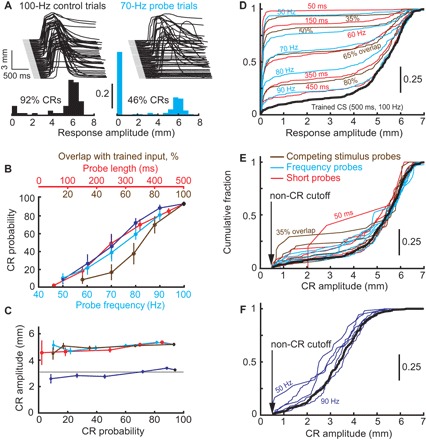
Fig. 2. Behavioral summary of binary choice.

(A) Example eyelid responses (eyelid position as a function of time) and frequency distribution of response amplitudes to trained input (100 Hz, black, left) and to 70-Hz frequency probes (cyan, right). In about half of trials, 70-Hz probes resulted in non-CR, but CR amplitudes were all or none when they happened. (B) CR probability decreases as probe stimuli become more different from the trained input. Data are shown for all three protocols as follows: competing stimulus probes (brown), short probes (red), and frequency probes (cyan for animals trained to 6-mm CRs, blue to 3-mm CRs). (C) Mean CR amplitude as a function of CR probability remained constant in all three probe protocols, same color code as in (B). (D) Cumulative distribution functions (CDFs) of distributions of response amplitudes to each probe (color-coded) or trained input (black). (E) Same as (D), but with non-CRs removed from each distribution. (F) Same as (E) for rabbits trained to 3-mm target CR amplitude.
