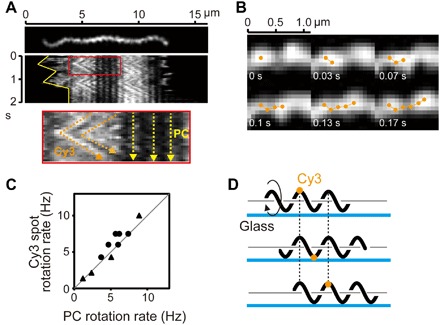
Fig. 3. Fluorescent observation of outer membrane dynamics.

(A) Crawling cell labeled with Cy3-NHS. In a kymograph, the yellow solid line indicates cell migration (top). In an enlarged kymograph (bottom), orange and yellow dashed lines indicate translational movements of fluorescent spots and slip-less crawling of the cell, respectively. (B) A montage shows an example trajectory of a fluorescent spot. (C) The rotation rates of the PC and Cy3 fluorescent spots determined from speed versus time traces for individual cells are shown. The rotations of PC and Cy3 fluorescent spots were simultaneously analyzed at several different time periods for each trace, and data obtained from two different cells are shown by black dots and triangles (total of 11 data points). A gray line with a slope of 1 is shown. (D) Schematic explanation of fluorescent dye movement attached to a cell crawling on the surface with rotation of a helical cell body.
