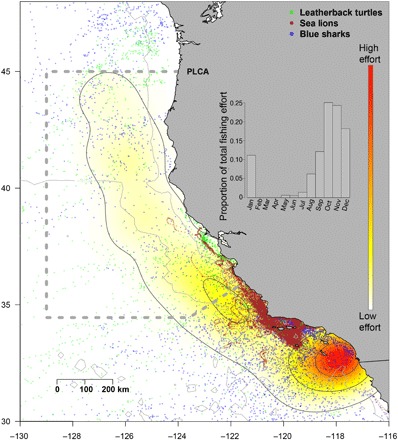
Fig. 1. Map of tracking and fisheries observer data relative to the PLCA.

Fisheries observer data are shown as kernel densities, from low (yellow) to high (red) effort. The greatest fishing effort was spatially concentrated in the Southern California Bight. The three tagged species are shown as points, with leatherback turtles migrating from western Pacific breeding grounds to forage in the California Current, blue sharks migrating north-south in the California Current seasonally, and California sea lions remaining within the study area for the duration of our analyses. Inset: The majority of fishing effort (80%) has taken place between August and December throughout the period of the study, with a peak in October.
