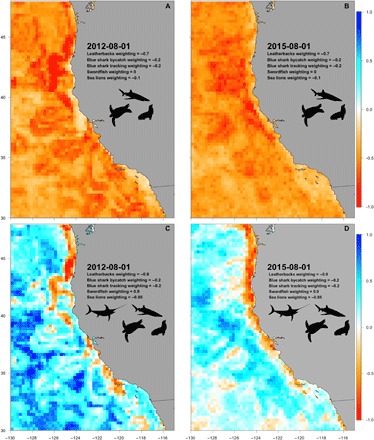
Fig. 3. Predicted risk surfaces for bycatch species and integrated EcoCast product for 1 August 2012 and 2015.

(see movies S1 to S4 for the entire season). Bycatch-only model results for an (A) average year, 2012, in the California Current and (B) an anomalously warm year, 2015, for leatherback turtles, blue sharks, and California sea lions. Integrated EcoCast model predictions for (C) 2012 and (D) 2015 incorporate swordfish in addition to the three aforementioned bycatch species. Values range from −1 (low catch and high bycatch) to 1 (high catch and low bycatch). Risk weightings reflect management concern with leatherbacks and swordfish having the highest, followed by blue sharks, and California sea lions having the lowest (see the Supplementary Materials for details and sensitivity analysis). Risk weightings can be adjusted dependent on management priorities, such as when the fishing season progresses or priorities change.
