Figure 3.

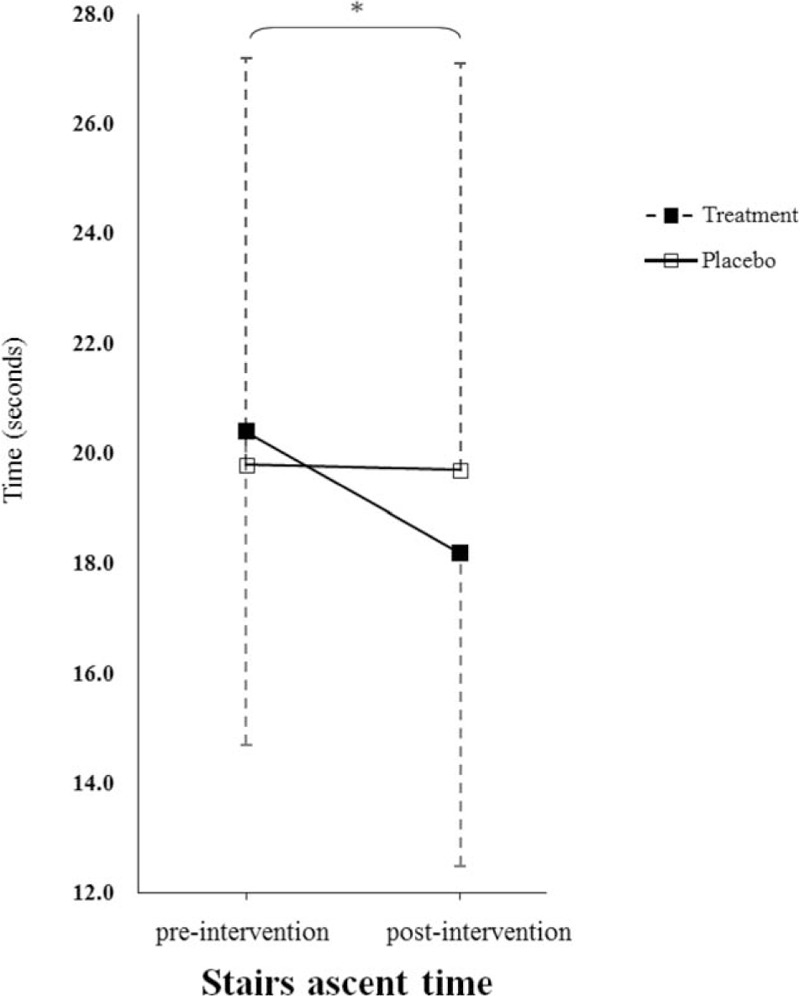
Mean and standard deviation of changes of stair ascent time associated with insole use for 12 weeks. Solid square, treatment group; hollow square, placebo group. ∗P < .05.

Mean and standard deviation of changes of stair ascent time associated with insole use for 12 weeks. Solid square, treatment group; hollow square, placebo group. ∗P < .05.