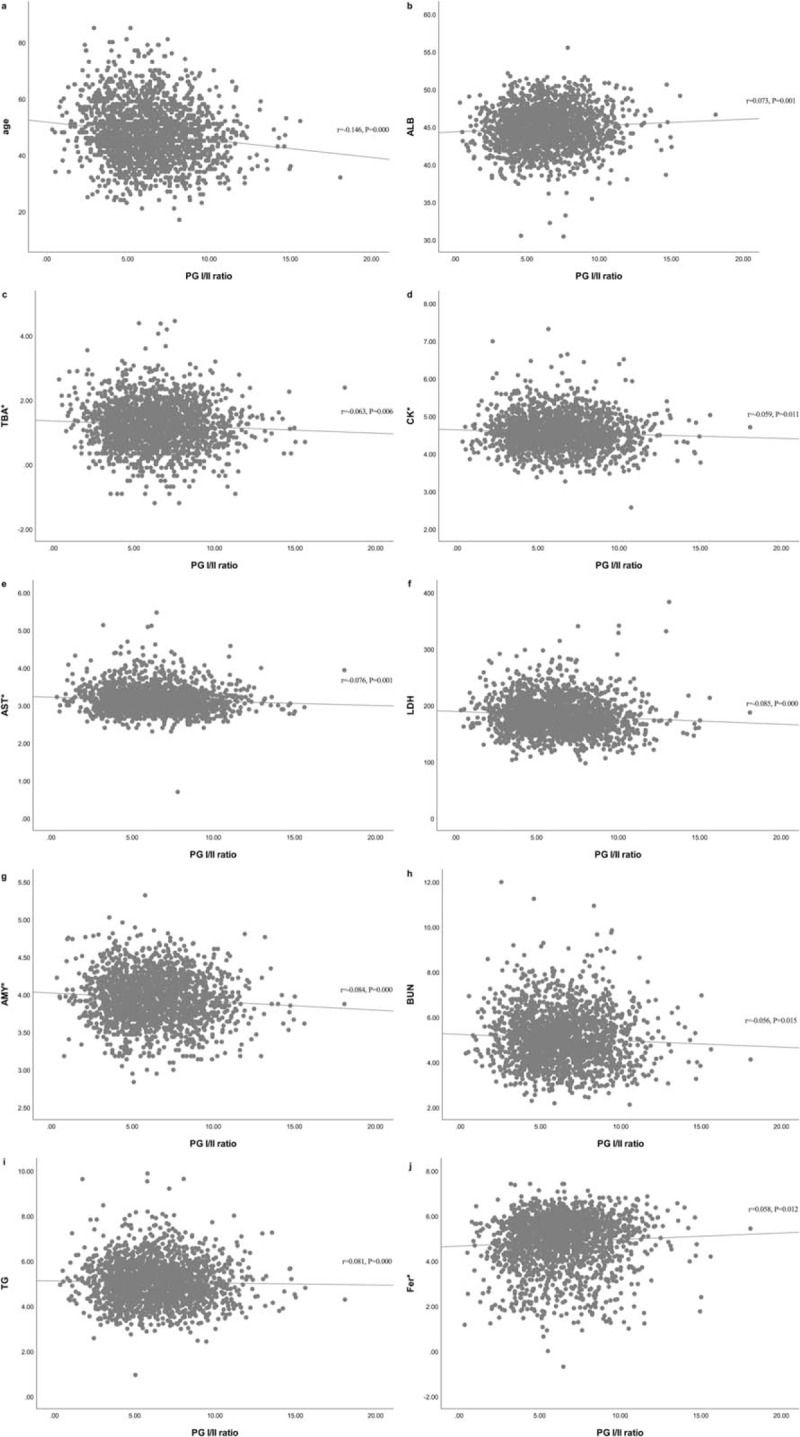
Figure 2.

Scatter plots for correlation between the PG I/II ratio and other variables. (A) Age. (B) ALB = albumin. (C) TBA = total bile acid. (D) CK = creatine kinase. (E) AST = aspartate aminotransferase. (F) LDH = lactate dehydrogenase. (G) AMY = amylase. (H) BUN = blood urea nitrogen. (I) TG = triglyceride. (J) Fer = ferritin. ∗Variables were logarithmic transformed due to skewed distribution.
