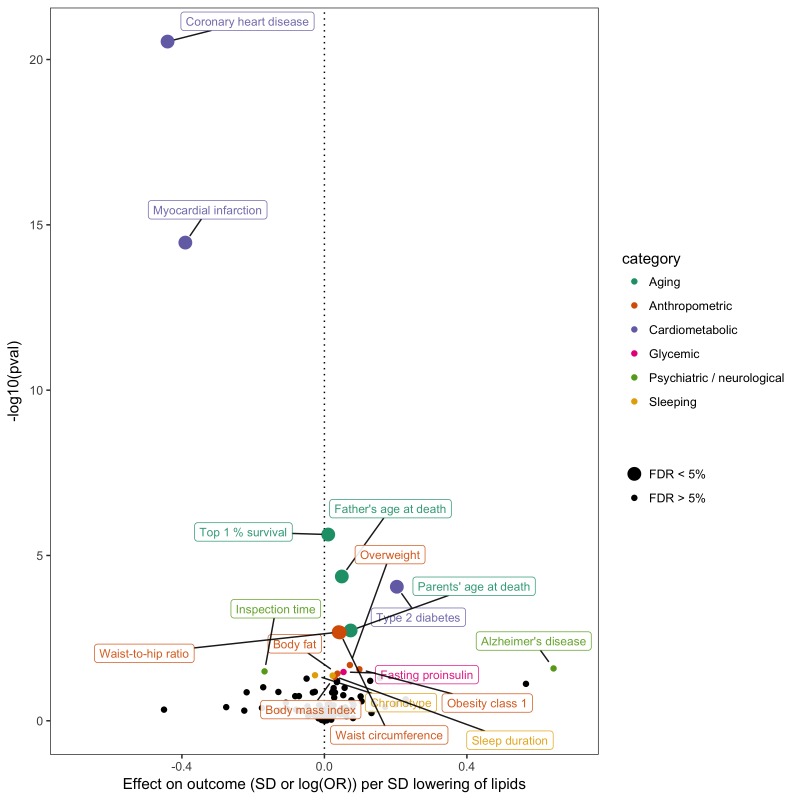
Figure 5. Effect of lower low density lipoprotein cholesterol on 150 traits in MR-Base.
The x-axis shows the standard deviation (SD) change or log odds ratio (OR) for each of 150 traits per SD decrease in low density lipoprotein (LDL) cholesterol. The y-axis shows the p-value for the association on a -log10 scale. The effects on the x-axis correspond to the slope from fixed effects inverse variance weighted (IVW) linear regression of single nucleotide polymorphism (SNP)-outcome effects regressed on the SNP-LDL effects. Those results that have a p-value<0.05 are labelled. Larger points denote false discovery rate (FDR) < 0.05. LDL cholesterol was instrumented by 62 SNPs.

