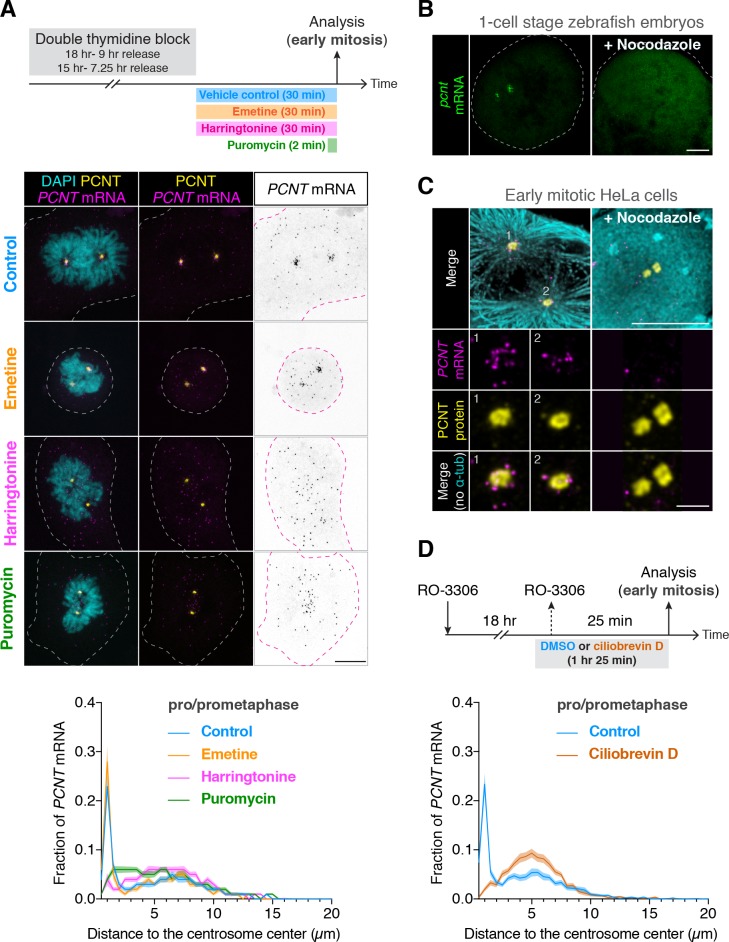
Figure 4. Centrosomal localization of pcnt/PCNT mRNA requires intact polysomes, microtubules, and dynein activity.
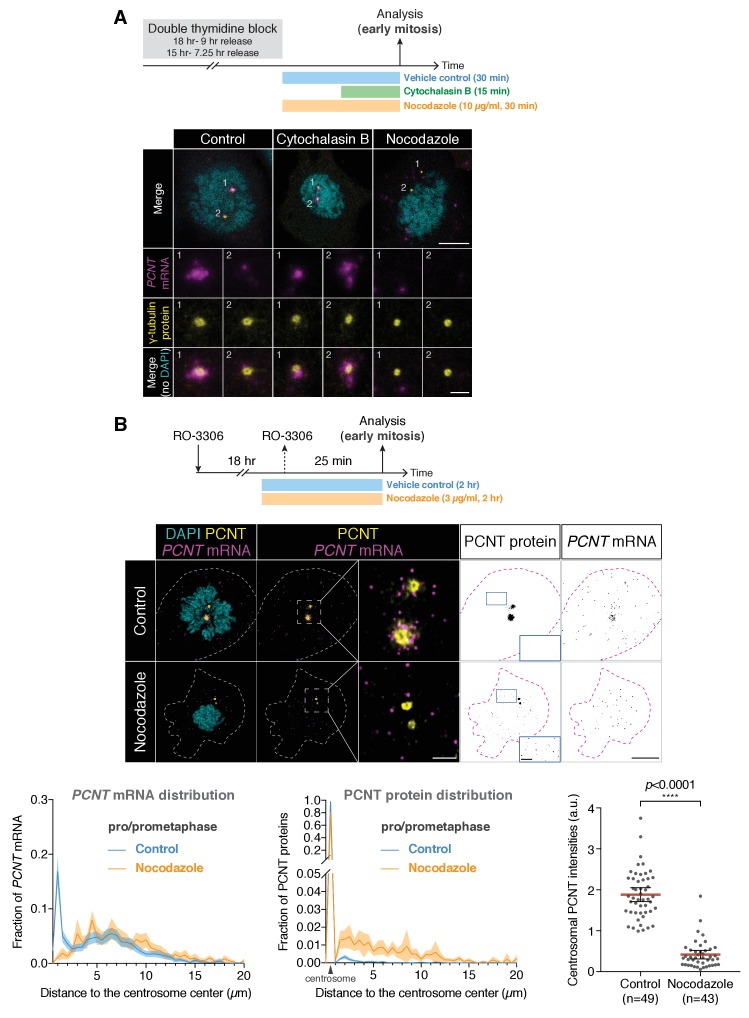
(A) HeLa cells were synchronized by a double thymidine block and treated with DMSO vehicle (Control), 208 µM emetine, 3.76 µM harringtonine for 30 min, or 300 µM puromycin for 2 min before anti-PCNT immunostaining and PCNT smFISH. Representative confocal images and quantification of the PCNT mRNA distribution are shown for each condition. The distribution of PCNT mRNA in cells was quantified by measuring the distance between 3D rendered PCNT smFISH signals and the center of the nearest centrosome (labeled by anti-PCNT immunostaining). The fractions of mRNA as a function of distance to the nearest centrosome (binned in 0.5 µm intervals) were then plotted as mean (solid lines) ±95% CI (shading) from three biological replicates. n = 48, 45, 57, and 51 cells for control, emetine, harringtonine, and puromycin conditions, respectively. Note that PCNT mRNA moved away from the centrosome upon the harringtonine or puromycin treatment, but stayed close to the centrosome upon the emetine treatment, similar to the control. (B) Zebrafish embryos were injected with DMSO vehicle or 100 µg/ml nocodazole at the one-cell stage followed by pcnt FISH. (C) HeLa cells were treated with DMSO vehicle or 3 µg/ml nocodazole for 2 hr at 37°C before anti-α-tubulin, anti-PCNT immunostaining, and PCNT smFISH. Note that pcnt/PCNT mRNA in early embryos (B) and in early mitotic cells (C) was no longer enriched at the centrosome after microtubules were depolymerized. (D) HeLa cells were synchronized by RO-3306 and treated with DMSO vehicle or 50 µM ciliobrevin D for 1 hr 25 min before anti-PCNT immunostaining and PCNT smFISH. The distribution of PCNT mRNA in cells was quantified as in (A). n = 63 and 70 cells for control and ciliobrevin D conditions, respectively, from a representative experiment (two technical duplicates per condition). Note that PCNT mRNA was no longer enriched at the centrosome upon the ciliobrevin D treatment. Dashed lines delineate the cell boundaries. Scale bars, 10 µm (A), 100 µm (C), 10 µm (D), and 2 µm (inset in D).
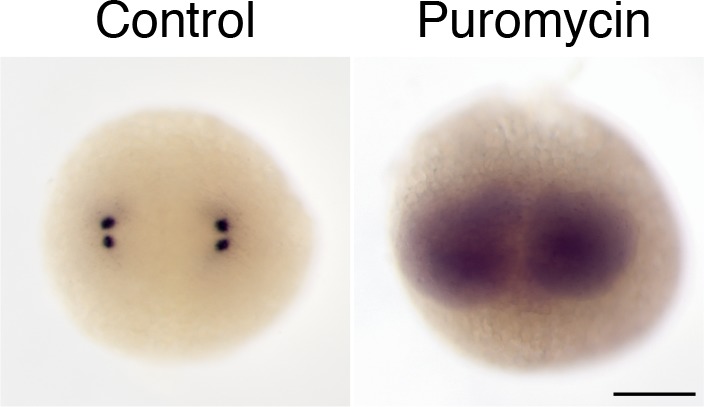
Figure 4—figure supplement 1. Centrosomal localization of zebrafish pcnt mRNA depends on intact polysomes.

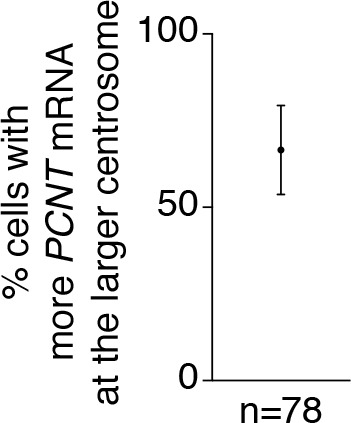
Figure 4—figure supplement 2. More PCNT mRNA was often enriched near the larger centrosome in early mitosis.


