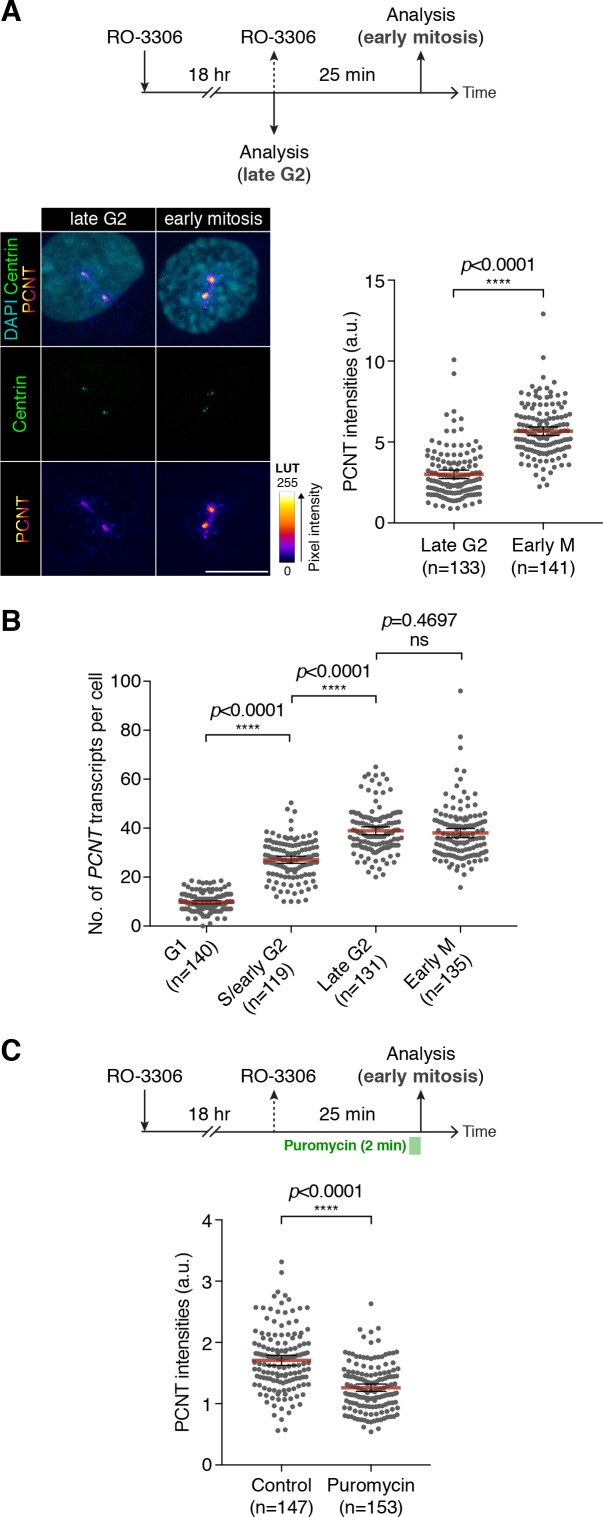
Figure 5. Centrosomal localization of PCNT mRNA/polysomes contributes to PCNT incorporation into mitotic centrosomes.
(A) Centrin-GFP RPE-1 cells—at either late G2 or early M phase—were subjected to anti-PCNT immunostaining. Representative confocal images are shown for each condition. A ‘fire’ lookup table (LUT) was used to show PCNT signal intensities. The sum intensity of anti-PCNT signals from both centrosomes of each cell was measured and plotted. (B) Numbers of PCNT mRNA at different cell cycle stages of Centrin-GFP RPE-1 cells were determined by PCNT smFISH. S phase/early G2 cells were identified by EdU labeling for 30 min. (C) HeLa cells were treated with vehicle control or 300 µM puromycin for 2 min before anti-PCNT immunostaining. The sum intensity of anti-PCNT signals from both centrosomes of each prophase or prometaphase cell was measured and plotted. Data are represented as mean ±95% CI. ‘n’ indicates the total number of cells analyzed from two (A), three (B), and two (C) biological replicates. p-values were obtained with Student’s t-test (two-tailed). a.u., arbitrary unit. Scale bar: 10 µm.

