. 2018 Apr 30;7:e34959. doi: 10.7554/eLife.34959

Figure 6. ASPM mRNA is enriched at centrosomes in a translation-dependent manner during mitosis.

Prometaphase/metaphase RPE-1 cells were treated with vehicle (Control) or 300 µM puromycin for 2 min at 37°C (Puromycin) before fixation, followed by anti-PCNT immunostaining and ASPM smFISH. Representative confocal images and quantification of the ASPM mRNA distribution are shown for each condition. The distribution of ASPM mRNA in cells was quantified by measuring the distance between 3D rendered ASPM smFISH signals and the center of the nearest centrosome (labeled by anti-PCNT immunostaining). The fractions of mRNA as a function of distance to the nearest centrosome (binned in 0.5 µm intervals) were then plotted as mean (solid lines)±95% CI (shading) from two biological replicates. n = 76 and 81 cells for control and puromycin conditions, respectively. Note that ASPM mRNA was enriched at the centrosomes/spindle poles of the metaphase cell, but became dispersed throughout the cell upon a short puromycin treatment. Scale bars: 10 µm.

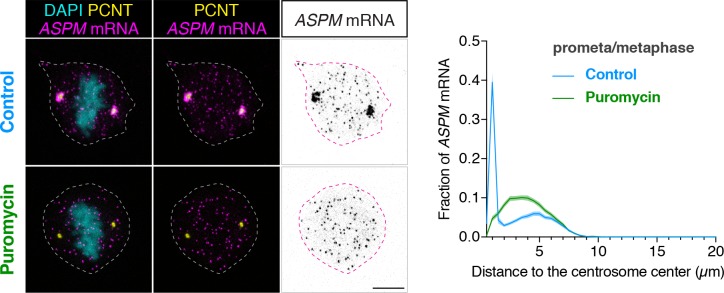
Figure 6—source data 1. The source data to plot the histogram in Figure 6.
DOI: 10.7554/eLife.34959.027

Figure 6.

Figure 6—figure supplement 1. ASPM mRNA is enriched at centrosomes in a translation-dependent manner during mitosis.

Figure 6—figure supplement 1.

Prometaphase HeLa cells were treated with vehicle (Control) or 300 µM puromycin for 2 min at 37°C (Puromycin) before fixation, followed by anti-PCNT immunostaining and ASPM smFISH. Representative confocal images and quantification of the ASPM mRNA distribution are shown for each condition. The distribution of ASPM mRNA in cells was quantified as in Figure 6. Data are from a representative experiment (two technical duplicates per condition). n = 17 and 27 cells for control and puromycin conditions, respectively. Note that ASPM mRNA was enriched at the centrosomes/spindle poles of the prometaphase cell, but became dispersed throughout the cell upon a short puromycin treatment. Scale bars: 10 µm.
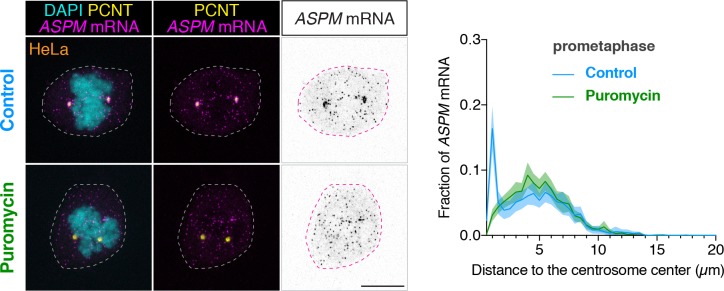
Figure 6—figure supplement 1—source data 1. The source data to plot the histogram in Figure 6—figure supplement 1.
DOI: 10.7554/eLife.34959.026