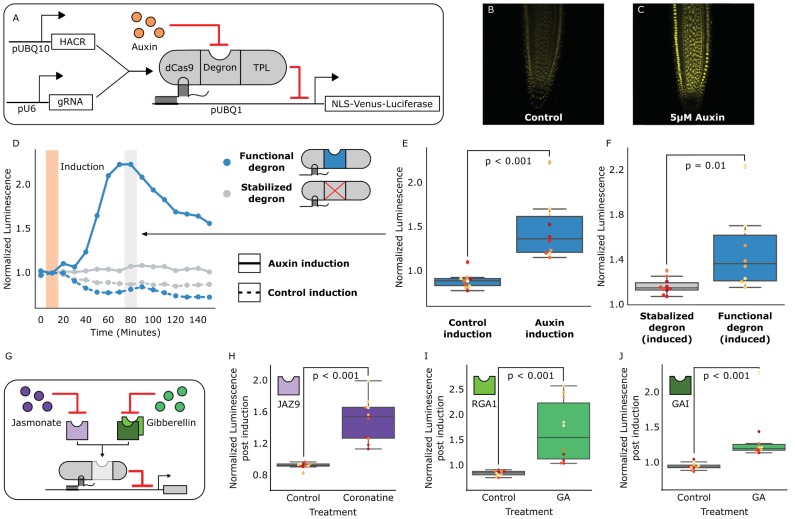
Figure 1. HACRs modulate gene expression upon exogenous hormone treatment.
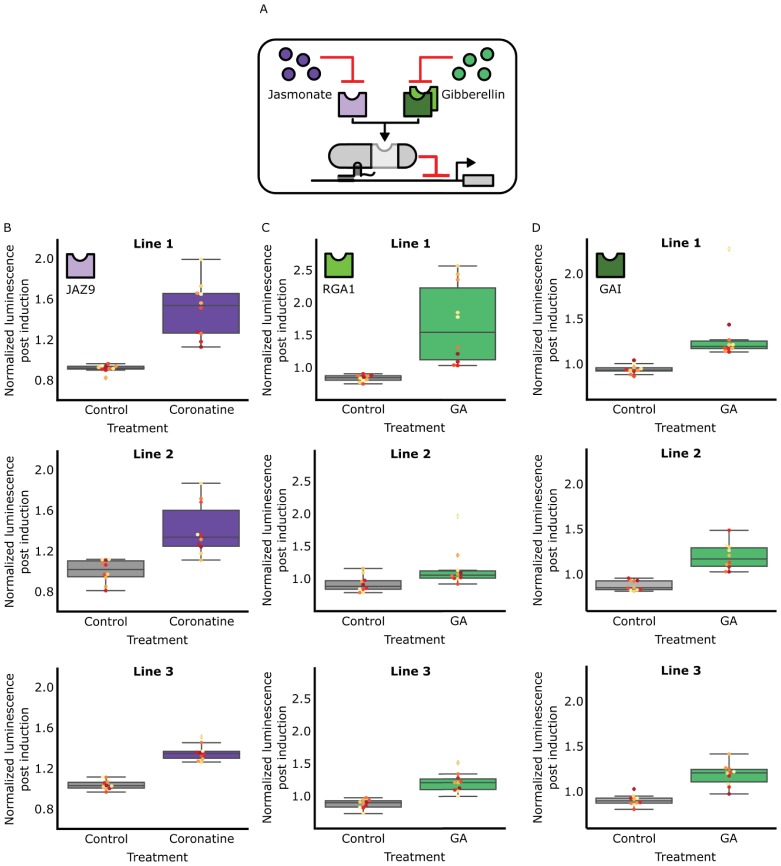
(A) A general schematic of the constructs transformed into Arabidopsis thaliana to test HACR hormone response. (B,C) Confocal microscopy images of root tips from plant lines with an auxin HACR regulating a Venus reporter 24 hr after treatment with (B) control or (C) 5 µM auxin. (D) An example of a luciferase based time course assay testing whole seedlings of an auxin HACR line treated with auxin (solid blue line) and a control (dashed blue line). The timepoint of auxin induction is highlighted with an orange bar. The time point of maximum auxin response is highlighted by the grey bar. (E) The difference between auxin and control induction at the time of maximum auxin response for the tested seedlings (n = 10) is summarized in the box plot. Every seedling is represented as a different colored dot. (F) A HACR variant line with a stabilized auxin degron was also assayed (D, solid and dashed grey lines) and the response to auxin of these seedlings compared to seedlings of the line with a functional auxin degron at the time of maximum auxin response are summarized in box plot in F. (G) A schematic of how the hormone specificity of HACRs were altered by swapping the hormone degron. (H,I,J) These box plots summarize the response of transgenic seedlings carrying these constructs (n = 10) to treatment with either control or the appropriate hormone. The degron used in the HACR is specified in the top left corner of the plot. Every seedling is represented as a different colored dot. All p-values reported were calculated using a one-way ANOVA.


