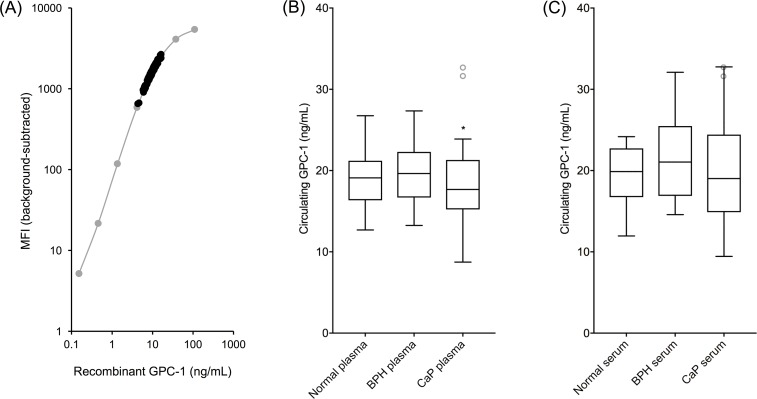
Figure 5. Circulating human GPC-1 as a CaP biomarker.
MIL-38/3G5 Luminex® assay measurements for circulating GPC-1 protein. (A) Recombinant GPC-1 standard curve (grey) overlayed with circulating GPC-1 measurements from plasma and serum samples (black). (B) Tukey plot of circulating GPC-1 in plasma samples from normal, BPH, and CaP patients (n = 15). (C) Tukey plot of circulating GPC-1 in matched serum samples from the same normal, BPH, and CaP patients (n = 15). Tukey plots determined two outliers in the CaP plasma samples and no outliers in the serum samples. Outlier CaP plasma samples, along with the matched serum samples from the same patients, are shown as grey, unfilled circles. Statistical significance for non-CaP plasma vs CaP plasma (*p = 0.0483) and for BPH plasma vs CaP plasma (*p = 0.0473) was determined by unpaired t-tests with outliers removed.

