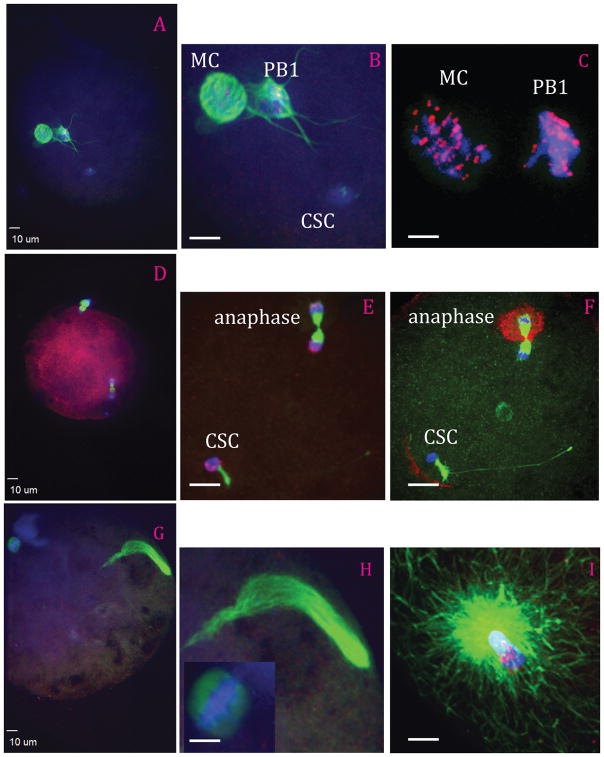
Figure 1.
Events during zygote development observed between 4 and 16h after ICSI. a,b: Condensed sperm chromatin (CSC, lower right), maternal chromosomes (MC, left) and first polar body (PB1, just to right of MC); (c) representation of the kinetochores localized on MC and PB1; (d,e) anaphase to telophase transition with CSC with acrosome portion of the sperm (lower left), anaphase/telophase of MC, extruding the second polar body; (f) actin cap surrounding the set of chromosomes being extruded in the second polar body, sperm tail visible next to CSC; (g,h) formation of the male pronucleus (indicated by elongated tubulin structure), MC (h, left insert); and (i) tubulin aster formation around the sperm head at the time of sperm DNA decondensation (blue, DNA; red, centromeres and kinetochores, except in panel f red indicates actin; green, tubulin).

