
Figure 4.
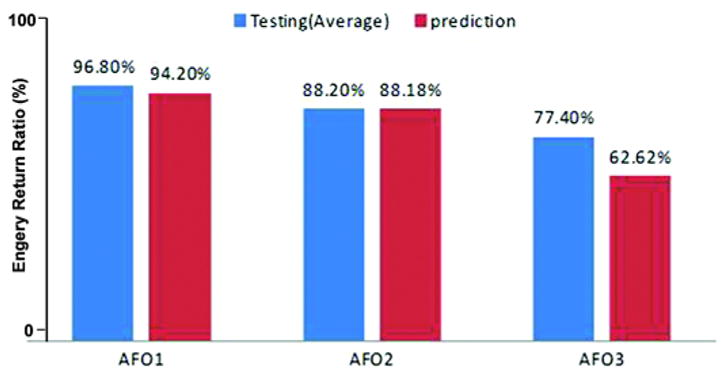
Energy return ratio comparison between testing and prediction (relative errors for ankle-foot orthosis [AFO] 1, AFO2, and AFO3 are 2.68%, 0.02%, and 19.09%, respectively).
Official websites use .gov
A
.gov website belongs to an official
government organization in the United States.
Secure .gov websites use HTTPS
A lock (
) or https:// means you've safely
connected to the .gov website. Share sensitive
information only on official, secure websites.
Energy return ratio comparison between testing and prediction (relative errors for ankle-foot orthosis [AFO] 1, AFO2, and AFO3 are 2.68%, 0.02%, and 19.09%, respectively).