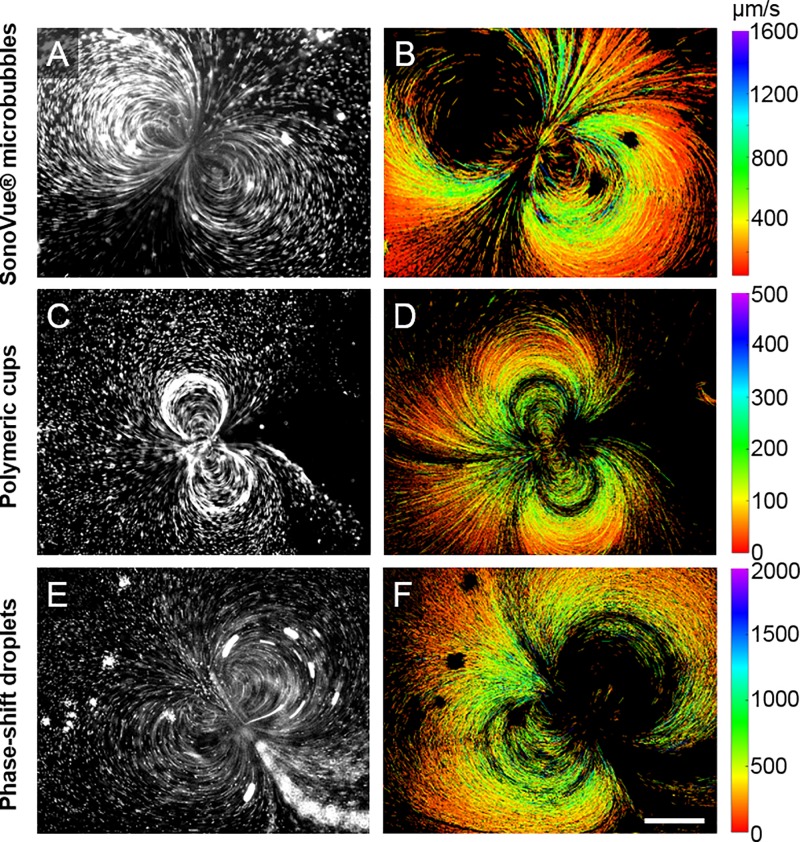
FIG. 4.
Streak velocimetry performed on videos of fluorescent tracer beads moving in cavitation microstreaming flows induced by SonoVue® microbubbles (top), gas-trapping sub-micron polymeric cups (middle), and phase-shift droplets (bottom) under ultrasound exposure inside the μLAR (511 kHz and ∼145 kPa PRFP from 40 V driving voltage). Figures show a brightness and contrast enhanced still from the videos analysed (left), and a pseudo-coloured composite of the headless velocity vectors for each streak analysed in the respective video (right). Colour bars are in μm/s. Scale bar = 350 μm.

