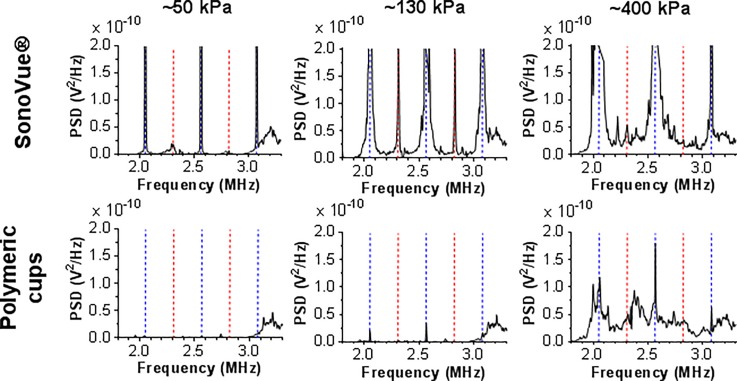
FIG. 5.
Acoustic emissions of SonoVue® and polymeric cups exposed to 511 kHz ultrasound in a μLAR device, as detected by an externally coupled PVDF film sensor. The power spectral density is shown following background subtraction using the acoustic emissions of a control sample (no cavitation nuclei). The blue dashed lines indicate the harmonic frequencies. The red dashed lines indicate the ultra-harmonic frequencies. The peak rarefactional pressure (PRFP) of the ultrasound is indicated in the figure.

