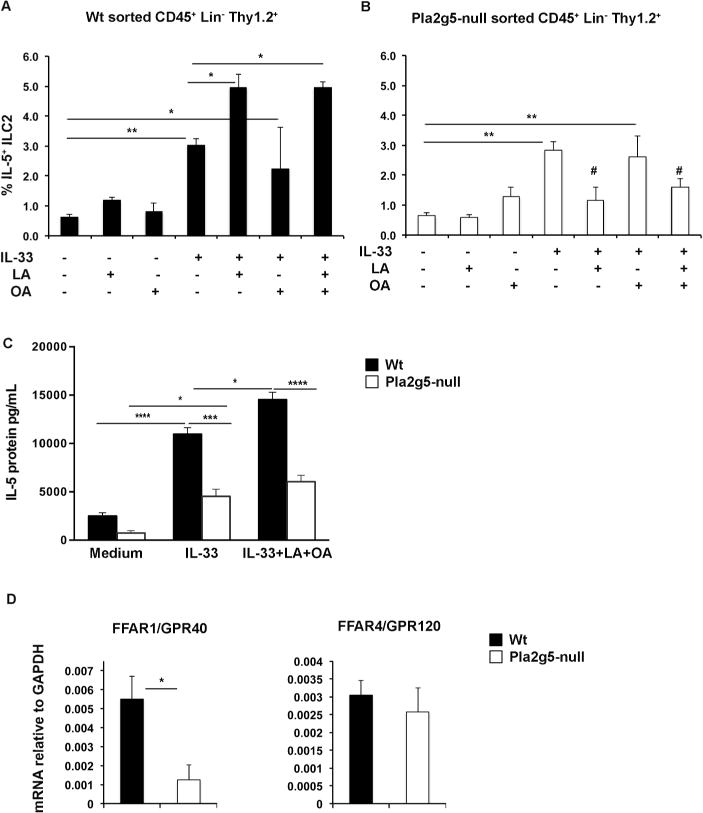
Figure 6. Differential LA- and OA-induced activation of sorted Wt and Pla2g5-null ILC2s and FFAR1 expression.

ILC2s were expanded in-vivo by 4 Alternaria challenges for 10 days. CD45+ lin-, Thy1.2+ cells were FACS sorted from 3–4 pulled lung homogenates, and rested for 40 hours prior to in-vitro stimulation with LA (200 μM), OA (200 μM), IL-33 (30ng/ml) or all together for 8 hours then analyzed by flow cytometry for percentage of IL-5 positive Wt (A) and Pla2g5-null (B) ILC2s. Unstimulated cells were used as controls. (C) IL-5 levels were measured by ELISA in the supernatants of sorted Wt and Pla2g5-null Thy1.2+ ILC2s stimulated as indicated. (D) Expression of FFAR1 and FFAR4 mRNA relative to GAPDH measured by qPCR in sorted ILC2s from Alternaria-treated Wt and Pla2g5-null mice. Data are from at least 3 independent experiments. Values are expressed as means ± SEM and were compared by One-way ANOVA (A–B), Two-way ANOVA (C) with Sidak’s correction for multiple comparisons, or t-test (D). ****P< 0.0001, *** P<0.0005, **P<0.005, *P< 0.05, # P<0.05 vs. IL-33 alone.
