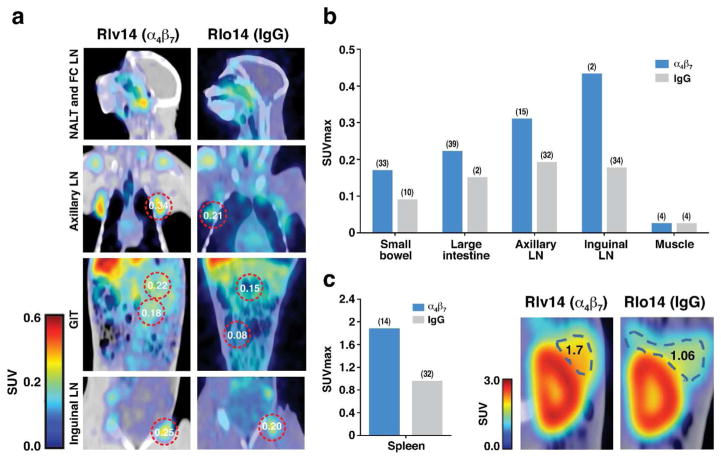
Figure 8. Immuno-PET/CT analysis of CD4+ cells in animals treated with ART+ α4β7 dual-therapy.
Comparison of CD4+ cell signals in two ART + α4β7 mAb treated animals and two ART-only animals at weeks 16 and 22. (a) Representative CD4+ cell immuno-PET/CT images from selected tissues of a macaque receiving dual-therapy (RIv14) or ART + control IgG (RLo14) at week 23. Selected SUVmax values are displayed. (b) Average SUVmax values in selected tissues for two animals treated with dual-therapy (ROq14, RIv14)(blue) and two animals treated with ART+ control IgG (RLo14 and RUs14)(copper) at week 23, 5 weeks after ART interruption. (c) Average SUVmax values as in b for spleen, with representative immuno-PET/CT images of spleen from RIv14 (ART + α4β7 mAb) and RLo14 (ART + control IgG). SUV max values are displayed. Median coefficient of variation (CV) indicated in parenthesis panels b and c.

