
Figure 2.
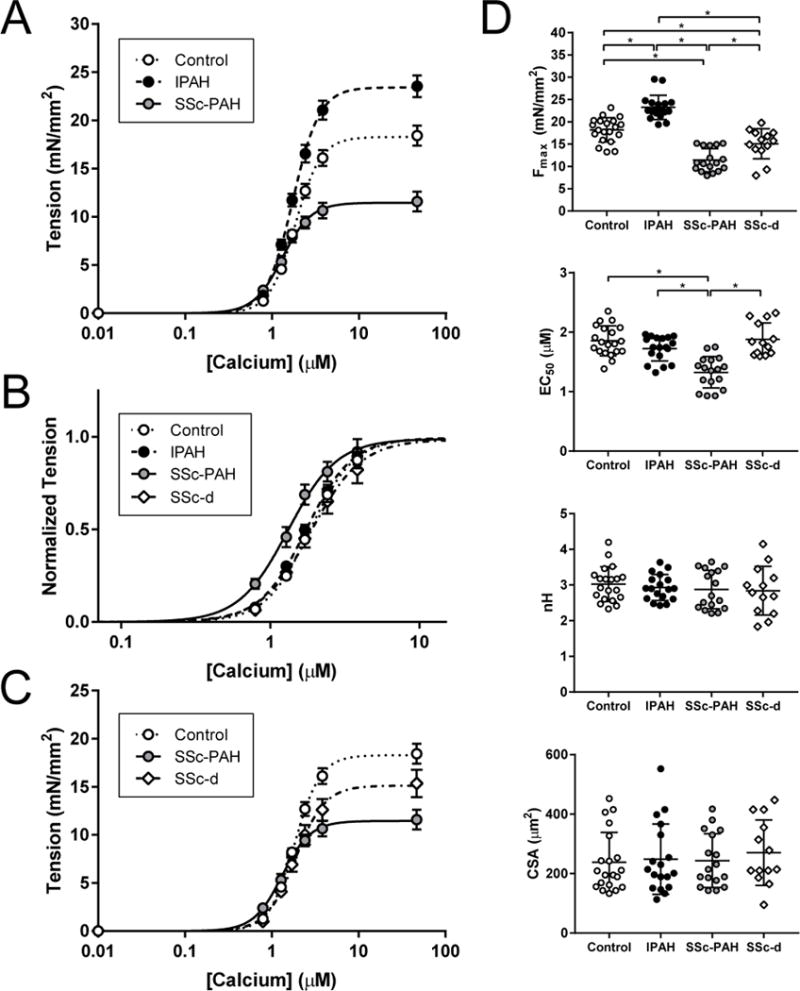
Force-Calcium curves in Control, IPAH, and SSc myofilaments
(A) Force-calcium data were obtained in non-failing control, IPAH, and SSc-PAH myocytes to obtain maximal calcium-activated tension (Fmax) and calcium sensitivity (EC50) (n=7 subjects/group). (B) Data were normalized to maximal tension to illustrate shifts in calcium sensitivity (measured as EC50, or the calcium concentration necessary for 50% maximal activation). (C) Myofilament force-calcium data of control, SSc-PAH, and SSc subjects free of PAH (SSc-d). (D) Fmax, EC50, Hill coefficient (h), and myocyte cross-sectional area (CSA) data; data presented as mean ± SD. Fmax was increased in IPAH versus controls, whereas it was decreased in SSc-PAH versus both control and IPAH; in SSc-d, Fmax was intermediate between control and SSc-PAH. EC50 was decreased in SSc-PAH versus control, IPAH, and SSc-d. There was no significant difference between groups in Hill coefficient or myocyte cross-sectional area (CSA). * significant difference in post-hoc comparison.