
Figure 2. Identification of candidate resolution parameters.
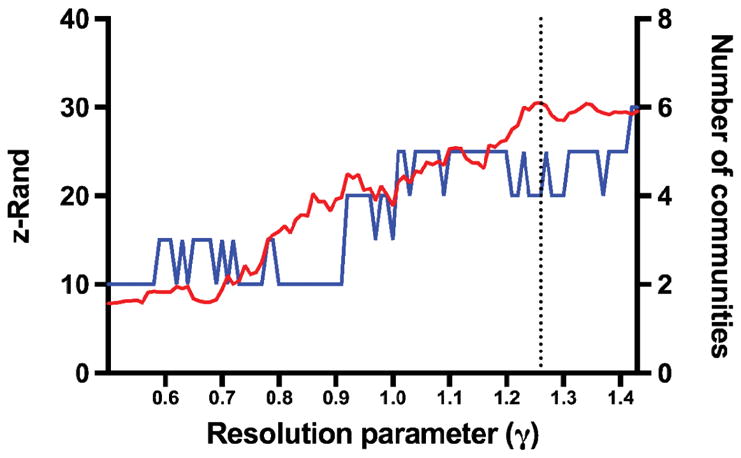
Plot representing the z-Rand scores and number of communities for each resolution parameter (γ). The number of communities were determined after the association-reclustering step. The dashed line represents the local z-Rand maximum (30.5), corresponding to γ = 1.26, at which the outputs of the Louvain algorithm were most stable (while the total number of communities remained ≤ 6).