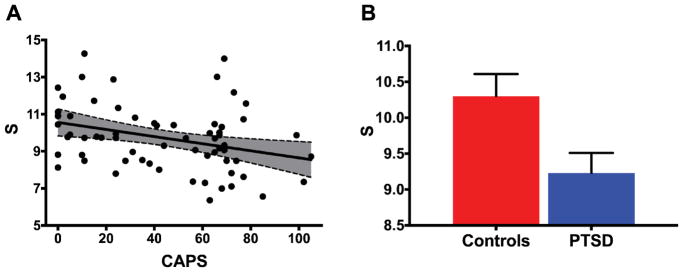
Figure 4. PTSD and DMN connectivity strength.
(A) Scatter plot depicting the correlation between PTSD severity, as measured by the Clinician Administered PTSD Scale (CAPS), and DMN overall connectivity strength (S) [r(64) = −0.329, p = 0.0075]. The gray area is the 95% confidence band of the best-fit line. (B) Bar graph depicting means and standard error of S across groups [CC: mean = 10.30 ± 0.31; PTSD: mean = 9.23 ± 0.28; p = 0.014].

