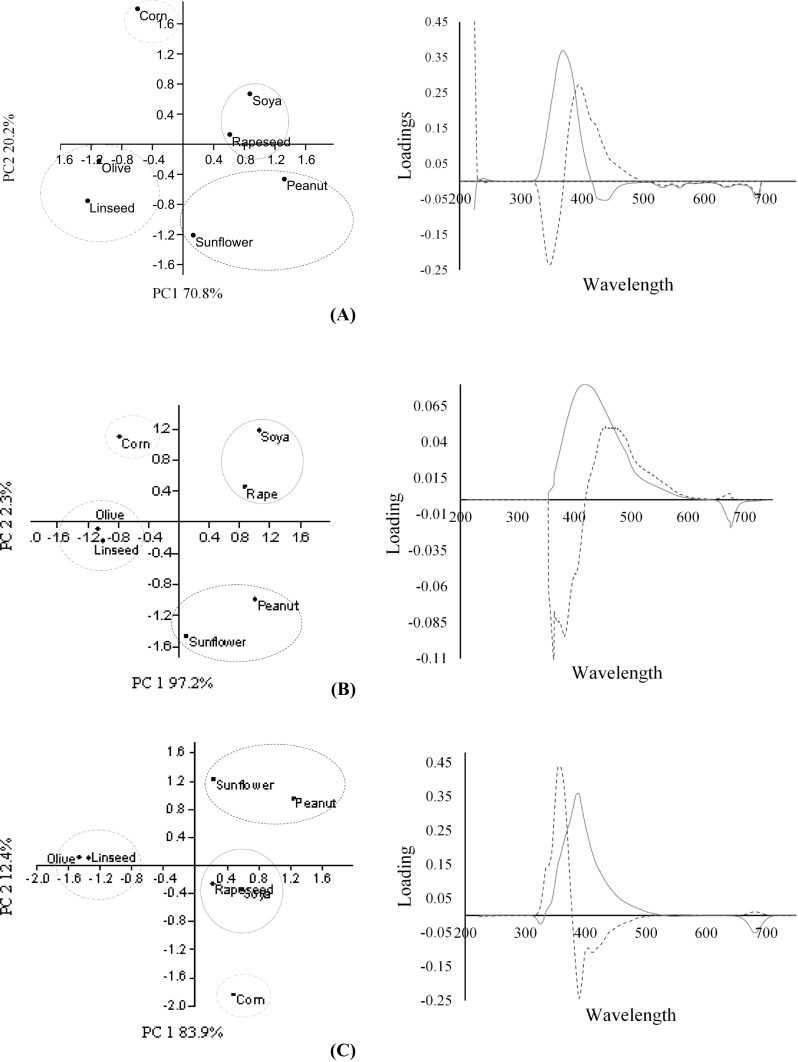
Fig. 2.

PCA scores plots (left column) for the discrimination of EVOO and vegetable oil adulterants based on emission spectral data (a), excitation spectral data (b) and synchronised spectral data at 24 nm (c), and their corresponding loading plots (right column). The blue solid lines represent loading scores for PC1 while the red dotted lines represent loading scores for PC2 for the different wavelengths (x-axis)
