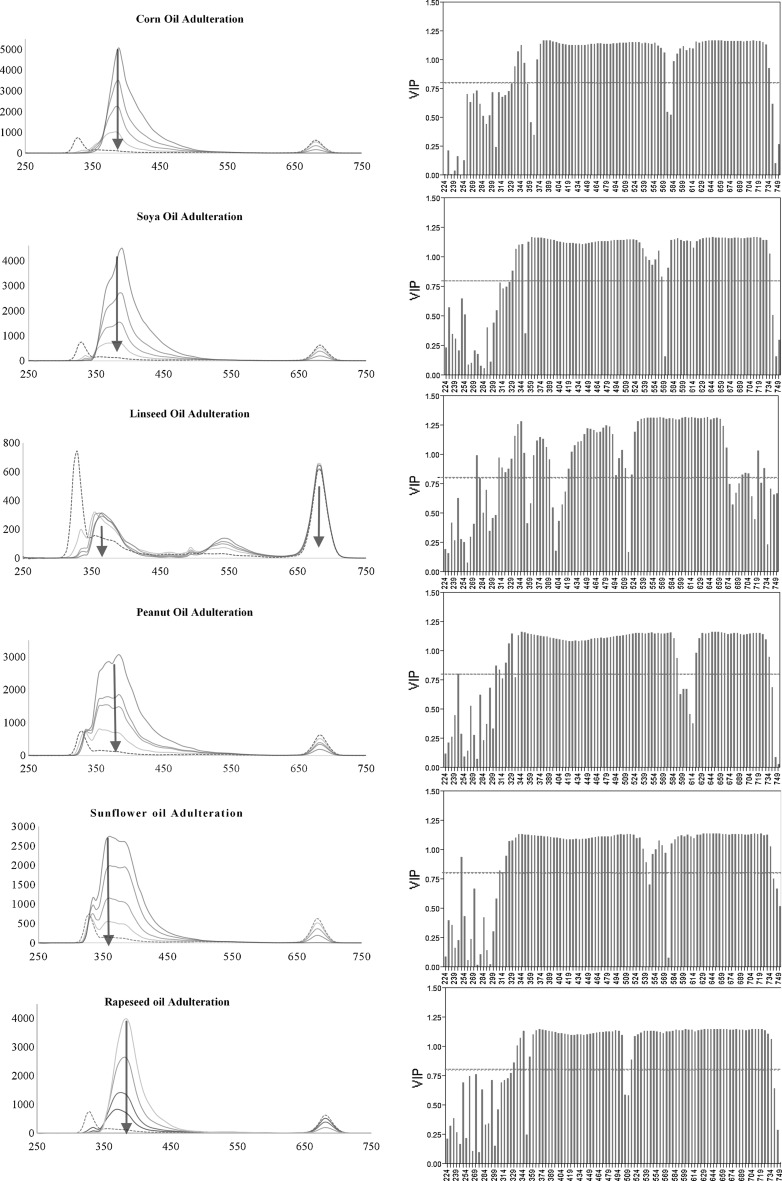
Fig. 3.
Synchronised spectra (left column) obtained at 24 nm with increasing concentration of seed oil adulteration (solid blue lines) and olive oil (black dotted line). Arrows indicate the maxima obtained for the different seed oils. The variable importance plots (right column) obtained on using PLSR, where the wavelengths (x-axis) and their corresponding VIP (y-axis) are plotted. The red dotted line indicates the VIP at 0.8 (color figure online)

