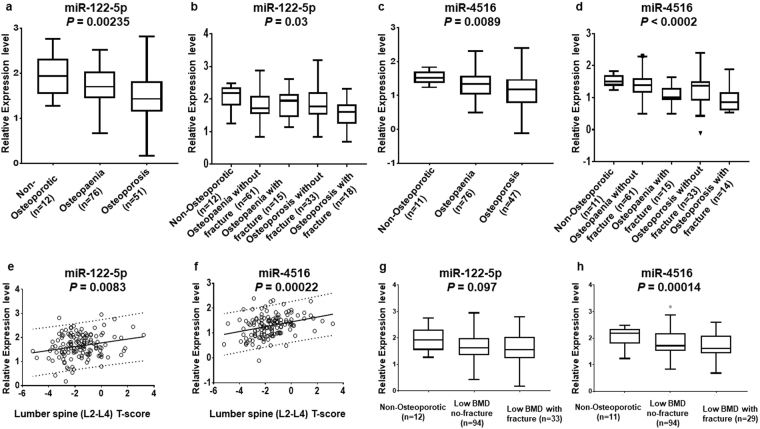
Figure 2.
Identification of microRNAs associated with osteoporosis. Box plots show the levels of microRNAs determined by RT-qPCR in clinical samples associated with the development of osteoporosis. The data includes 20 male participants, comprising one male control, 11 with osteopaenia and 8 with osteoporosis. These numbers were too small to warrant separate analysis. Panel (a), box plots show the levels of hsa-miR-122-5p among non-osteoporotic controls, osteopaenia and osteoporosis patients (P = 0.00235); Panel (b), box plots show a statistically significant correlation of hsa-miR-122-5p within the osteoporosis patients who had fracture (P = 0.03); Panel (c), box plots show the levels of hsa-miR-4516 among non-osteoporotic controls, osteopaenia and osteoporosis patients (P = 0.0089); Panel (d), box plots show that hsa-miR-4516 is associated with osteoporosis patient with fracture (P < 0.0002); Panel (e), the levels of hsa-miR-122-5p in clinical samples significantly increased with increasing lumbar spine (L2-L4) of the subject (P = 0.0083); Panel (f), the levels of hsa-miR-4516 in clinical samples significantly increased with increasing lumbar spine (L2-L4) of the subject (P = 0.00022); Panel (g), box plots show the levels of hsa-miR-122-5p among non-osteoporotic controls, low BMD patients without fracture and low BMD patients with fracture (P = 0.097); Panel (h), box plots show the levels of hsa-miR-4516 among non-osteoporotic controls, low BMD patients without fracture and low BMD patients with fracture (P = 0.00014).

