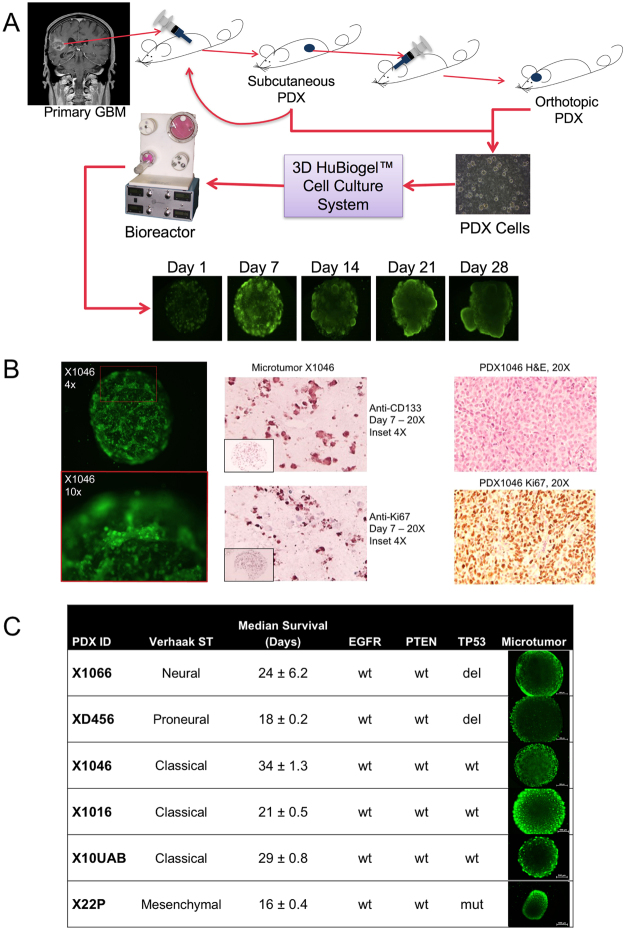
Figure 2.
3D xenoline microtumors as model of GBM. (A) Schematic for 3D microtumor production from PDX tumor cells. (B) Microtumor Calcein-AM live cell staining and IHC compared to PDX tumor. Microtumor characterization using Calcein-AM live cell staining (left 2 panels) and IHC staining of stem cell (CD-133) and proliferation (Ki-67) markers (middle two panels) is shown at low and high magnification to mimic in vivo tumors (H&E and Ki-67 staining shown for murine implanted tumors (right two panels) (magnification is indicated). (C) Selected PDX tumors with Verhaak et al. molecular subtype40, median survival, EGFR, PTEN and TP53 status as well as Calcein-AM imaging of Microtumor beads in Neurobasal medium at Day 7 at 4x magnification and 250 ms exposure. Scale bar is 500 µm.

