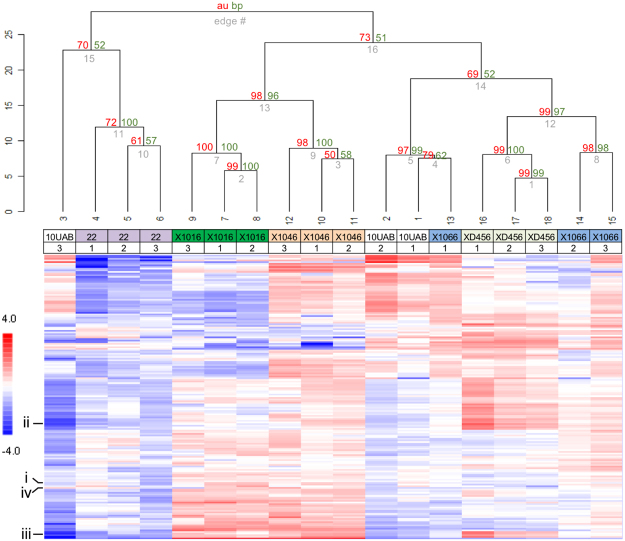
Figure 3.
Kinomic profiling showing molecular diversity of GBM xenoline microtumors. Kinomic heatmap of combined PTK and STK chip analyses with triplicates of each microtumor xenoline at Day 7. The GBM xenoline identity is labeled with biological replicate number indicated below the xenoline. Each cell is a phosphopeptide probe displayed as log-transformed change from peptide mean as higher (red) or lower (blue) than the average signal per peptide. Bootstrap resampling probability testing of clustering robustness using pvclust (R script). approximately unbiased (AU) score is shown in red and a normal bootstrap probability value (BP) is shown in green at the dendrogram hinges. AU values ≥95 indicate that the data highly supports the clustering. The 4 peptides shown in Fig. 1B are indicated.

