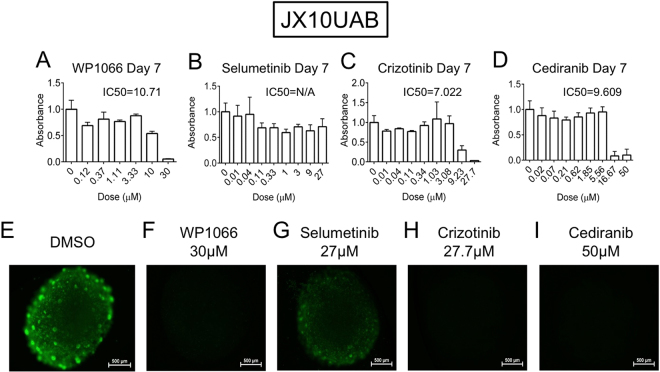
Figure 4.
Dose response of JX10UAB to WP1066, Selumetinib, Crizotinib, and Cediranib at Day 7. Raw MTT absorbance of (A) WP1066, (B) Selumetinib, (C) Crizotinib and (D) Cediranib are shown with DMSO control representing the 0 µM dose with calculated IC50 indicated (N/A = not applicable). (E–I) Calcein-AM imaging of DMSO or highest doses of each drug (30 µM, 27 µM, 27.7 µM, and 50 µM, respectively) at Day 7 at 4x magnification and 250 ms exposure. Scale bar is 500 µm.

