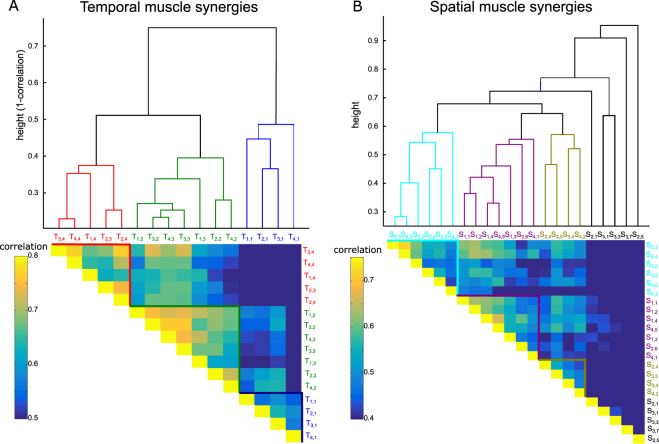
Figure 4.
Hierarchical cluster trees and the corresponding functional similarity matrices for the temporal muscle synergies (A) and the spatial muscle synergies (B) across all subjects. Synergy Ta,b represents the bth temporal synergy (S for spatial synergies) of subject a. Color-coded branches of the hierarchical trees represent highly similar synergies that are clustered together. Synergies are clustered based on the correlation of their confusion matrices. Pairwise correlation of the confusion matrices of synergies i and j is shown as entry (i, j) of the functional similarity matrix (see color-coding of similarity matrix regions and synergy labels).

