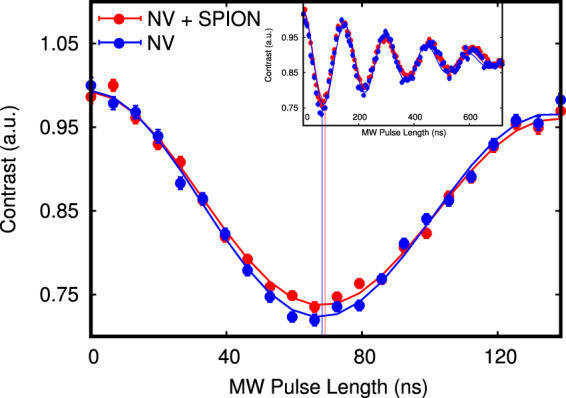
Figure 4.

Precise measurement of Rabi oscillations for the 2.855 GHz transition driven by a constant external AC magnetic field with the bare NV center (blue dots) and the NV center interacting with a proximal superparamagnetic nanoparticle (red dots), with the solid lines representing the data fits (via an exponentially decaying cosine function). The frequency difference is on the scale of = 90 ± 70 KHz, going from 7.33 ± 0.05 MHz with the bare NV center to 7.24 ± 0.05 MHz for a mutual NV-SPION separation of 64 ± 3 nm and a NV axis - SPION angle of 72 ± 1 deg. The full envelope of the Rabi oscillations is shown in the upper frame.
