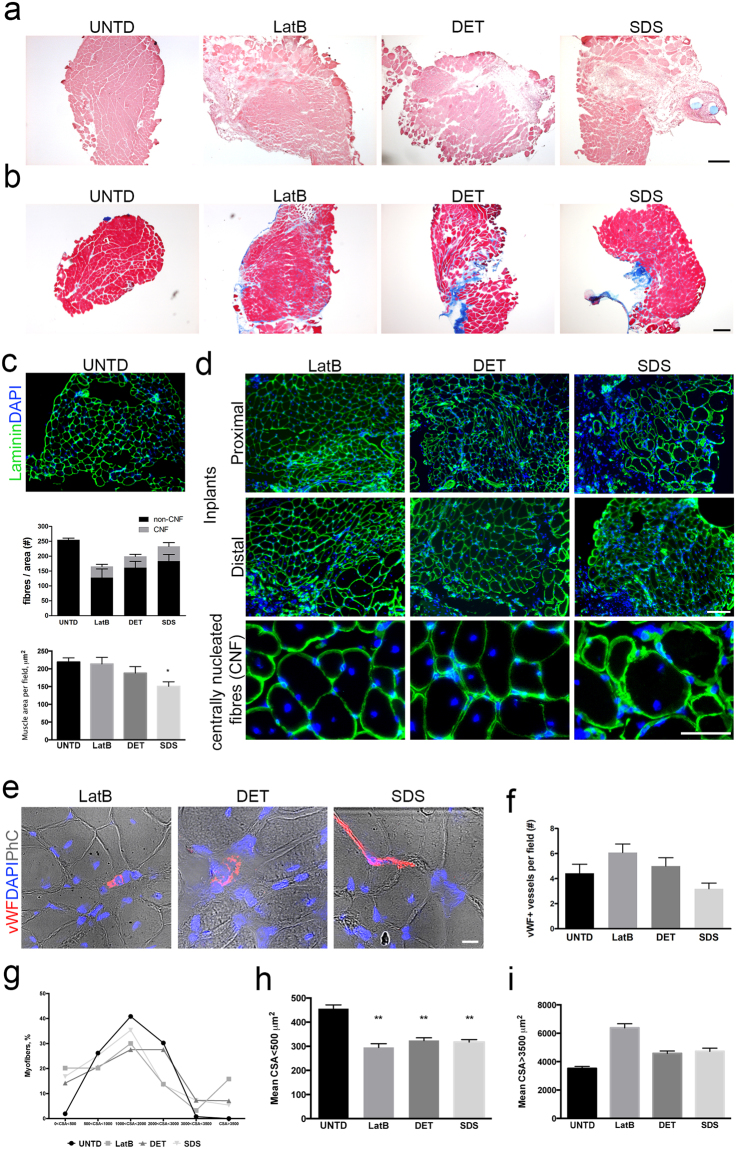
Figure 5.
Decellularised skeletal muscles induce muscle regeneration in a mouse model of VML. (a) H&E staining of cross-sections from contralateral untreated EDL (UNTD) and the middle region of LatB-, DET- and SDS-implanted scaffolds two months after implantation. Scale bar: 250 µm. (b) Masson’s Trichrome staining of cross-sections from UNTD muscles and the middle region of LatB-, DET- and SDS-implanted scaffolds two months after implantation. Scale bar: 250 µm. H&E staining of cross-sections from UNTD muscles and LatB-, DET- and SDS-implanted scaffolds two months after implantation. Cross-sections showed centrally nucleated fibres, connective tissue and myofibres of variable size into the implanted scaffold. Scale bar, 50 µm. (c) Representative images of immunofluorescence analysis for laminin (green) in cross-sections from contralateral untreated EDL muscles, and (d) LatB-, DET- and SDS-implanted scaffolds, two months after implantation. Nuclei were stained with dapi (blue). Scale bar, 100 µm. Bottom line: higher magnifications to show centrally nucleated fibres (CNF). Scale bar, 50 µm. (e) Quantification of the number of fibres per field and respective contribution of CNF and non-CNF in UNTD muscles and implanted scaffolds, using images of laminin immunofluorescence staining. (f) Quantification of muscle area per field in UNTD muscles and LatB-, DET- and SDS-implanted scaffolds two months after implantation. *P < 0.05 compared to UNTD; one-way ANOVA and Tukey’s multiple comparison test; n = 4–6, each group. (g) Representative immunofluorescence images of cross-sections from LatB-, DET- and SDS-implanted scaffolds stained with for von Willebrand factor (vWF, red) two months after implantation. Nuclei were stained with dapi (blue) and phase contrast (PhC) is shown to highlight staining localization and tissue structure (scale bar: 10 µm). (h) Quantification of the number of vWF+ vessels in implanted scaffolds (n = 4–6). (i) Percentage of myofibres with cross-sectional area (CSA) less the 500 µm2, between 500 and 1000 µm2, between 1000 and 2000 µm2, between 2000 and 3000 µm2, between 3000 and 3500 µm2, or more than 3500 µm2 in UNTD muscles, LatB-, DET- and SDS-implanted scaffolds two months after implantation. n = 4–6, each group. (j) Mean cross-sectional area (CSA) of myofibres showing CSA less than 500 µm2 in UNTD muscles, LatB-, DET- and SDS-implanted scaffolds two months after implantation. Data are shown as mean ± s.e.m. **P < 0.01, compared to contralateral untreated muscles; data were analysed by using Kruskal-Wallis and Dunn’s multiple comparison test; n = 4–6, each group. (k) Mean cross-sectional area (CSA) of myofibres showing CSA more than 3500 µm2 in EDL contralateral untreated muscles (UNTD), LatB-, DET- and SDS-implanted scaffolds two months after implantation. Data are shown as mean ± s.e.m. Statistical analysis was performed by using Kruskal-Wallis and Dunn’s multiple comparison test and reported in Supplementary Table 1.

