Fig. 3.

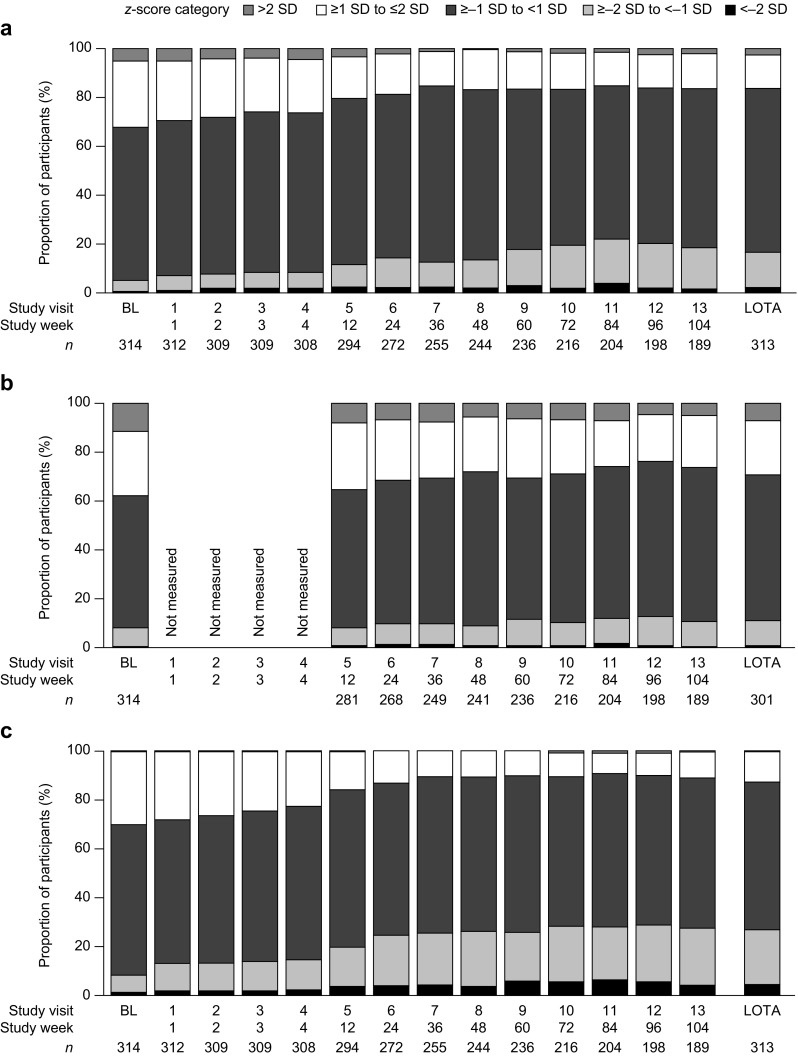
Proportions of participants in z-score categories for a weight, b height and c body mass index (BMI) by study visit and study week (safety analysis population; N = 314). BL baseline, LOTA last on-treatment assessment, SD standard deviation

Proportions of participants in z-score categories for a weight, b height and c body mass index (BMI) by study visit and study week (safety analysis population; N = 314). BL baseline, LOTA last on-treatment assessment, SD standard deviation