Figure 2.
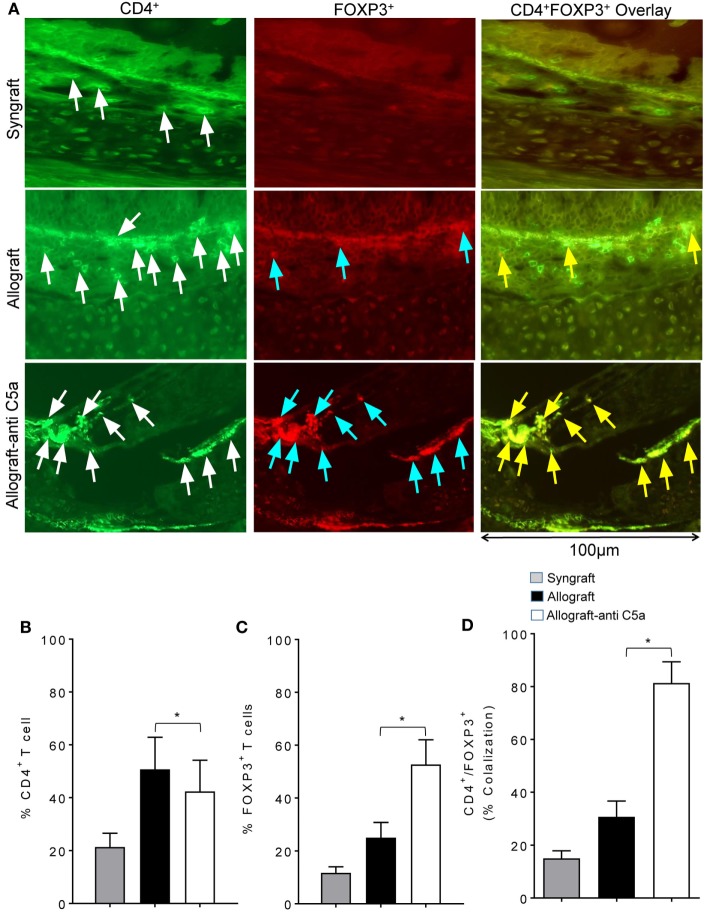
C5a blockade increased infiltration of regulatory T cell (Treg) in allograft. (A) Immunofluorescent staining for CD4 and forkhead box P3 (FOXP3) at d10 posttransplantation. (B–D) Morphometric analysis of graft infiltrating CD4+ T cells, FOXP3+ cells, and CD4+FOXP3+ colocalization (Tregs). Arrows highlighted individual CD4+ T cells (white arrows), FOXP3+ cells (blue arrows), and CD4+FOXP3+ Tregs (yellow arrows). Data are presented as means with SE of 3–4 transplants/time point/experiment, and repeats of three different experiments. *p < 0.05. Original magnification, ×40.

