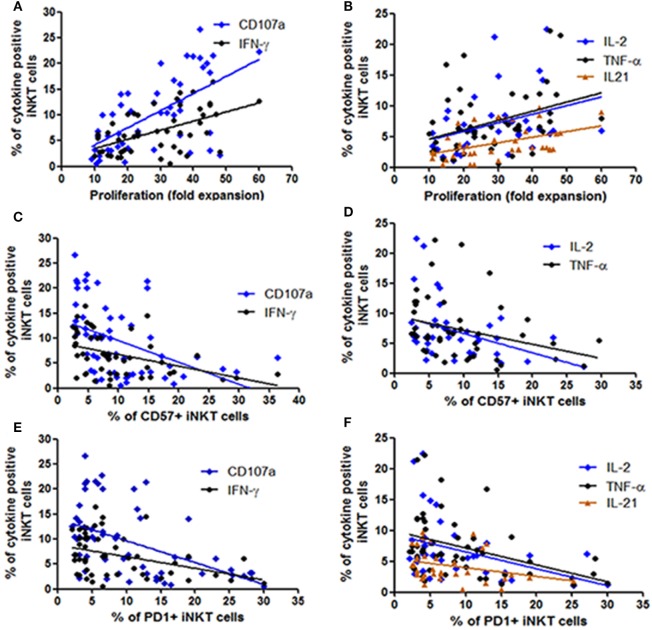
Figure 4.
Assessment the relationship between functionality of invariant natural killer T (iNKT) cells with their proliferation ability and expression of immune exhaustion and senescence markers. The scatter diagrams represent the correlation between the percent of iNKT cells secreting cytokines and expressing CD107a on the Y-axis with (A,B) proliferation ability (fold expansion) of the corresponding iNKT cells on the X-axis, (C,D) corresponding CD57 expressing iNKT cells on the X-axis, and (E,F) corresponding PD1 expressing iNKT cells on the X-axis.

