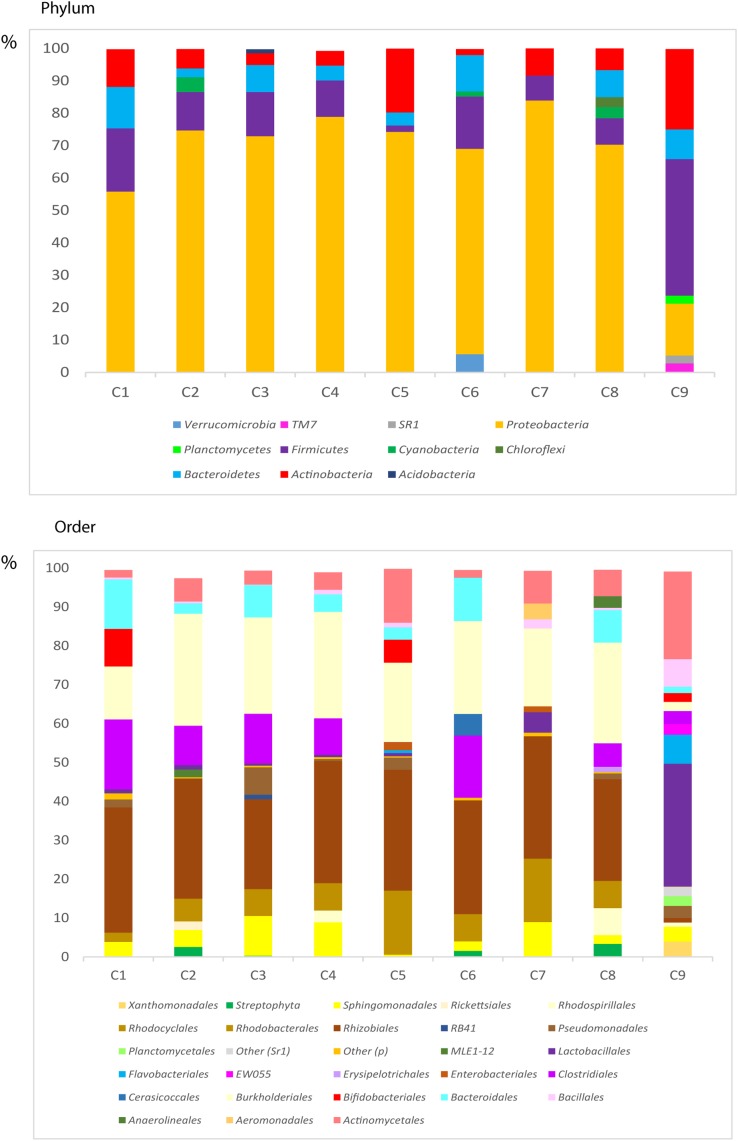
FIGURE 10.
Distribution of bacteria phyla and orders obtained by NGS of DNA from control subjects. Computational analyses of the sequences obtained on the Illumina platform using Qiime classified the data into bacteria phyla and orders. (Upper) Shows the results of bacteria phyla obtained from ERH samples of nine control subjects. (Lower) Shows the results of bacterial orders obtained from ERH samples of nine controls.

