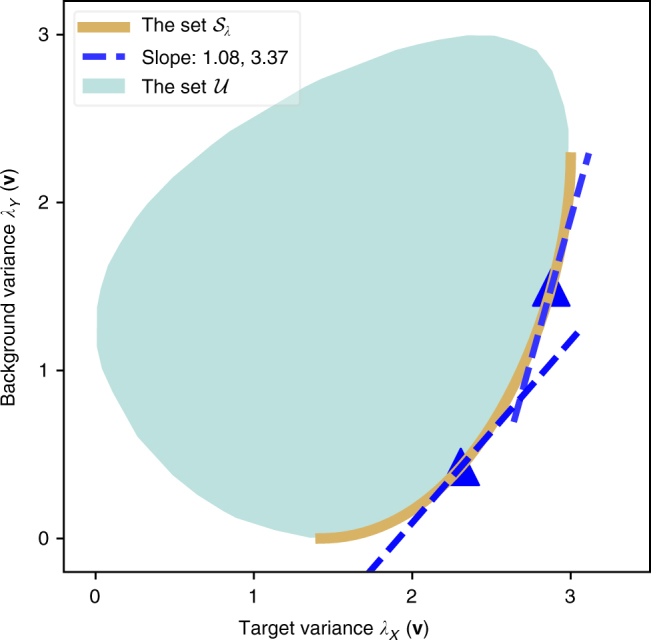
Fig. 5.

Geometric Interpretation of cPCA. The set of target–background variance pairs is plotted as the teal region for some randomly generated target and background data. The lower-right boundary, as colored in gold, corresponds to the set of most contrastive directions . The blue triangles are the variance pairs for the cPCs selected with α values 0.92 and 0.29 respectively. We note that they correspond to the points of tangency of the gold curve and the tangent lines with slope = 1.08, 3.37, respectively
