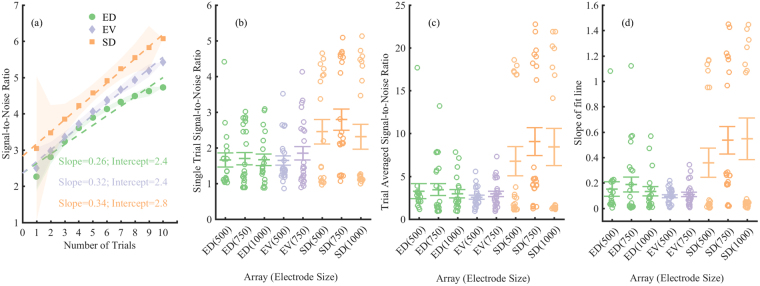
Figure 3.
Signal-to-noise ratios (SNRs). (a) Example of SNRs vs. number of trials (repetitions of stimuli) for the ED (green), EV (purple), and SD (orange) 750 µm diameter electrodes. Example traces were taken from electrodes closest to each other as determined on an x-ray image. Shaded areas indicate standard error of the mean. The lines are straight line fits (y = P*x + Q) for each array, where x is the number of trials, P is the slope of fit line, and Q is the intercept. (b) Single trial SNR. (c) SNR averaged over 10 trials. (d) The slopes ‘P’ of the fit lines shown in (a). Symbols show individual values, centre lines show mean values, error bars show standard error of the mean. Mood median test showed no significant effect of electrode size or location on either; (b) single trial SNR, (c) Trial averaged SNR or (d) the slope of fit line (p > 0.05).

