Figure 4.

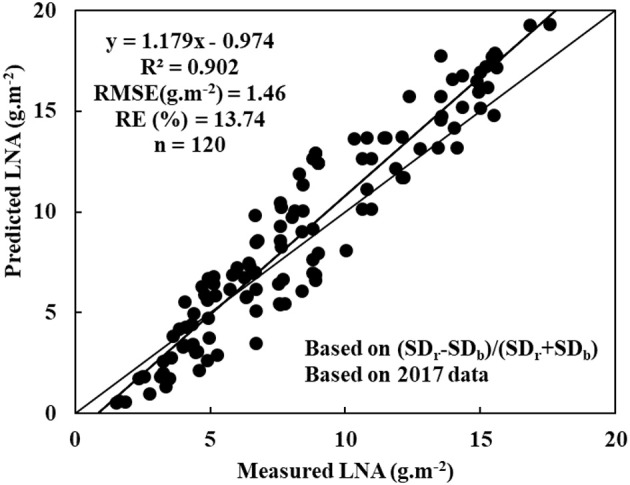
Evaluating the diagnostic model based on (SDr−SDb)/(SDr+SDb) using a different cultivar or even wheat grown elsewhere: y = 1.179x - 0.974, R2 = 0.902, RMSE (mg.g−1) = 1.46, RE(%) = 13.74, n = 120).

Evaluating the diagnostic model based on (SDr−SDb)/(SDr+SDb) using a different cultivar or even wheat grown elsewhere: y = 1.179x - 0.974, R2 = 0.902, RMSE (mg.g−1) = 1.46, RE(%) = 13.74, n = 120).