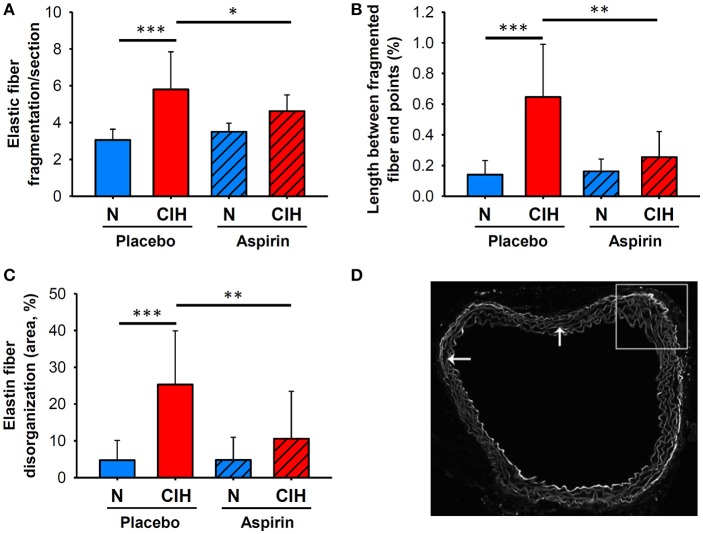
Figure 1.
Elastin network morphological remodeling associated with CIH and ASA treatment. (A) Quantification of EF per section, and LFF adjusted by total aortic wall area (B) (shown as %). (C) ED area in the aortic wall adjusted by total area (shown as %). (D) Representative images of the elastic network (scale bar = 50 μm), revealed by auto-fluorescence, with arrows indicating fragmented elastic fiber end points. (*p < 0.05; **p < 0.01; ***p < 0.001).

