Figure 3.

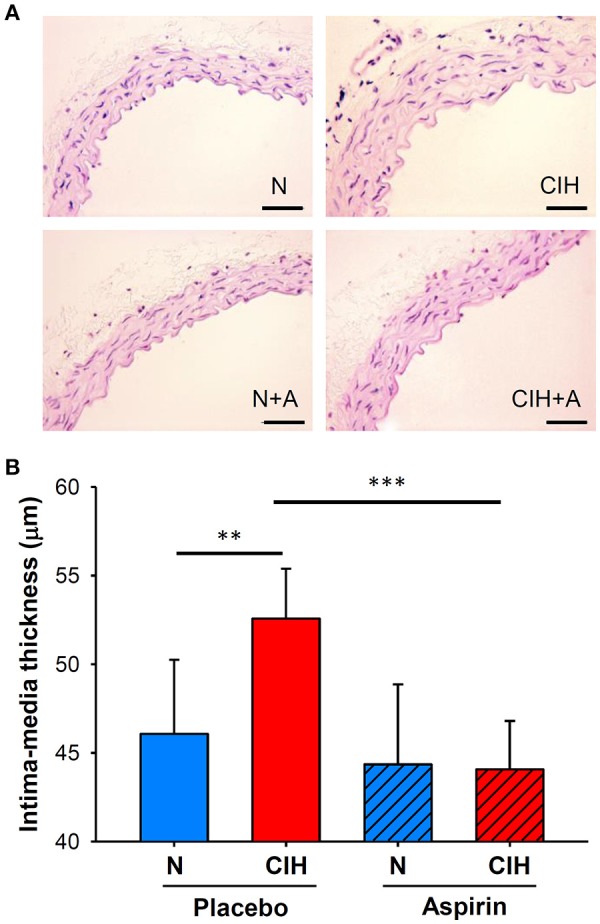
(A) Representative images of the aortic wall with H&E staining for each group (scale bar = 50 μm). (B) Histomorphometric analysis of IMT (shown as μm), H&E: hematoxylin and eosin. (**p < 0.01; ***p < 0.001).

(A) Representative images of the aortic wall with H&E staining for each group (scale bar = 50 μm). (B) Histomorphometric analysis of IMT (shown as μm), H&E: hematoxylin and eosin. (**p < 0.01; ***p < 0.001).