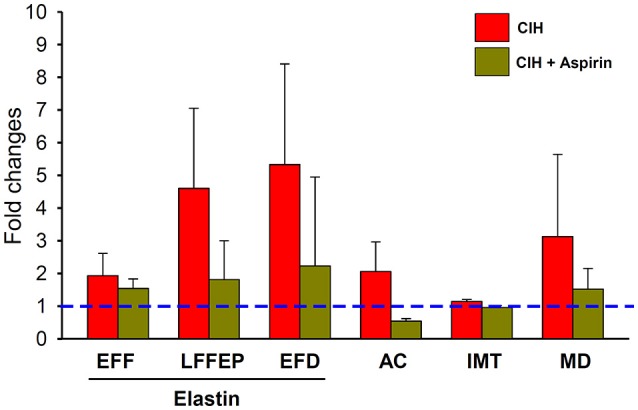
Figure 5.

Changes induced on histopathological measurements (EF, LFF, ED, AC, IMT, and MD) in response to CIH (red bar) and CIH+ASA (yellow bar) normalized to the normoxia group. Dashed blue line represents the normoxia+placebo reference normalized value). All CIH-induced changes (except in MD) were significantly prevented by ASA treatment.
