
FIGURE 2.
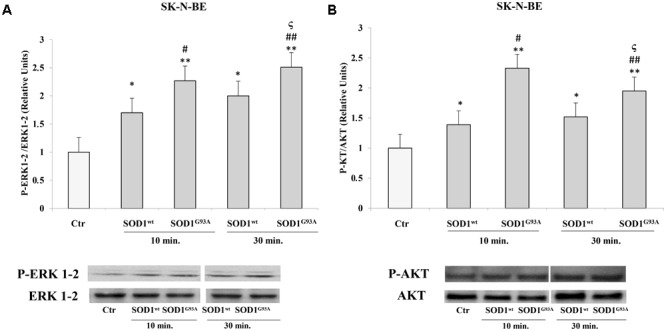
Activation of ERK1-2 and AKT trasductional pathways in presence of SOD1wt and SOD1G93A in SK-N-BE cells. Western blotting analysis of P-ERK (A) and P-AKT (B) in cells incubated with 400 ng/ml of SOD1wt and SOD1G93A for 10 and 30 min. The histograms show the mean values (+SE) evaluated by densitometric analysis of three independent experiments. The results were normalized to ERK1-2 and AKT respectively. ∗p < 0.05 vs. Ctr; ∗∗p < 0.001 vs. Ctr; #p < 0.05 vs. 10 min SOD1wt; ##p < 0.001 vs. 10 min SOD1wt; ςp < 0.05 vs. 30 min SOD1wt.