
FIGURE 3.
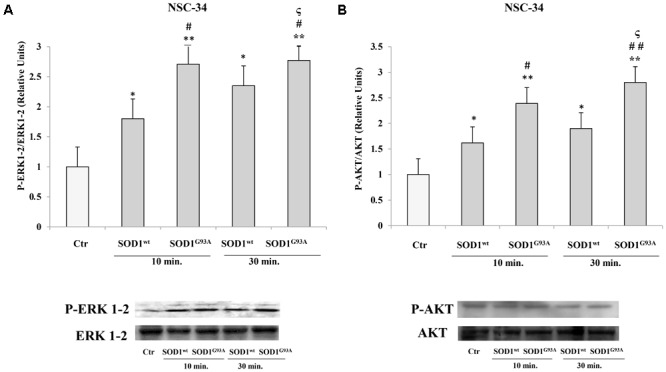
Activation of PLC-PKC-ERK1-2-AKT-dependent transduction pathway in presence of SOD1wt and SOD1G93A in NSC-34 cells. Western Blotting analysis of the levels of P-ERK 1-2 (A) and P-AKT (B) in NSC-34 cells incubated with 400 ng/ml of SOD1wt and with 400 ng/ml of SOD1G93A for times of 10 and 30 min. The data represent the means ± SEM of three independent experiments relative to control obtained by densitometric analysis of P-ERK1-2 and P-AKT protein bands normalized to ERK1-2 and AKT, respectively. ∗p < 0.05 vs. Ctr; ∗∗p < 0.001 vs. Ctr; #p < 0.05 vs. 10 min SOD1wt; ##p < 0.001 vs. 10 min SOD1wt; ςp < 0.05 vs. 30 min SOD1wt.