
FIGURE 5.
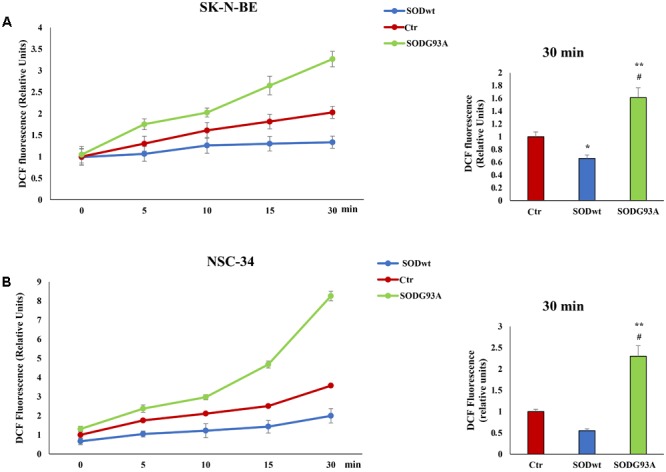
Fluorimetric Determination of Reactive oxygen species (ROS) levels. SK-N-BE (A) and NSC-34 (B) semiconfluent cells were incubated for 18 h in medium containing 0.2% FBS and then for 30 min with 400 ng/ml SOD1wt and mutated SOD1G93A. To determine Reactive Oxygen Species (ROS) levels, SK-N-BE (A) and NSC-34 (B) cells were incubated with 10 μM of the ROS sensitive probe DCHF-DA and ROS levels were measured by fluorometric analysis. The graphs on the left show the mean ± SEM values (n = 6) relative to control of the indicated time points. The histograms on the right show the values of 30 min point and the relative ANOVA analysis. ∗p < 0.05 vs. Ctr; ∗∗p < 0.001 vs. Ctr; #p < 0.001 vs. SODwt.