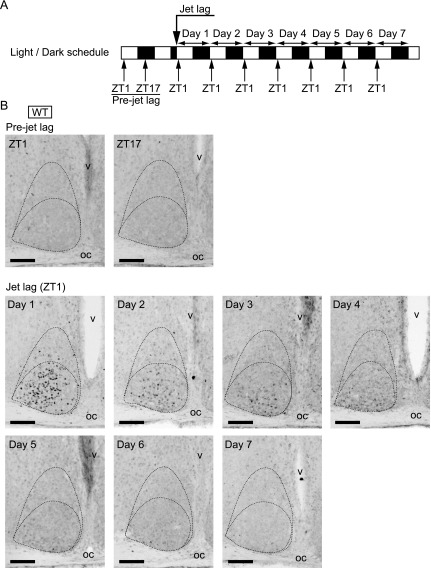
Fig. 2.
c-Fos expression in WT SCN before or after jet lag. (A) Sampling time course. White and black bars indicate light and dark phases, respectively. (B) Representative images of immunoreactivity to c-Fos in the SCN of WT mice before or after jet lag. Boundaries of the SCN and the ventrolateral and the central parts are shown in the dotted lines. oc, optic chiasma; v, third ventricle. Bar = 100 μm.

