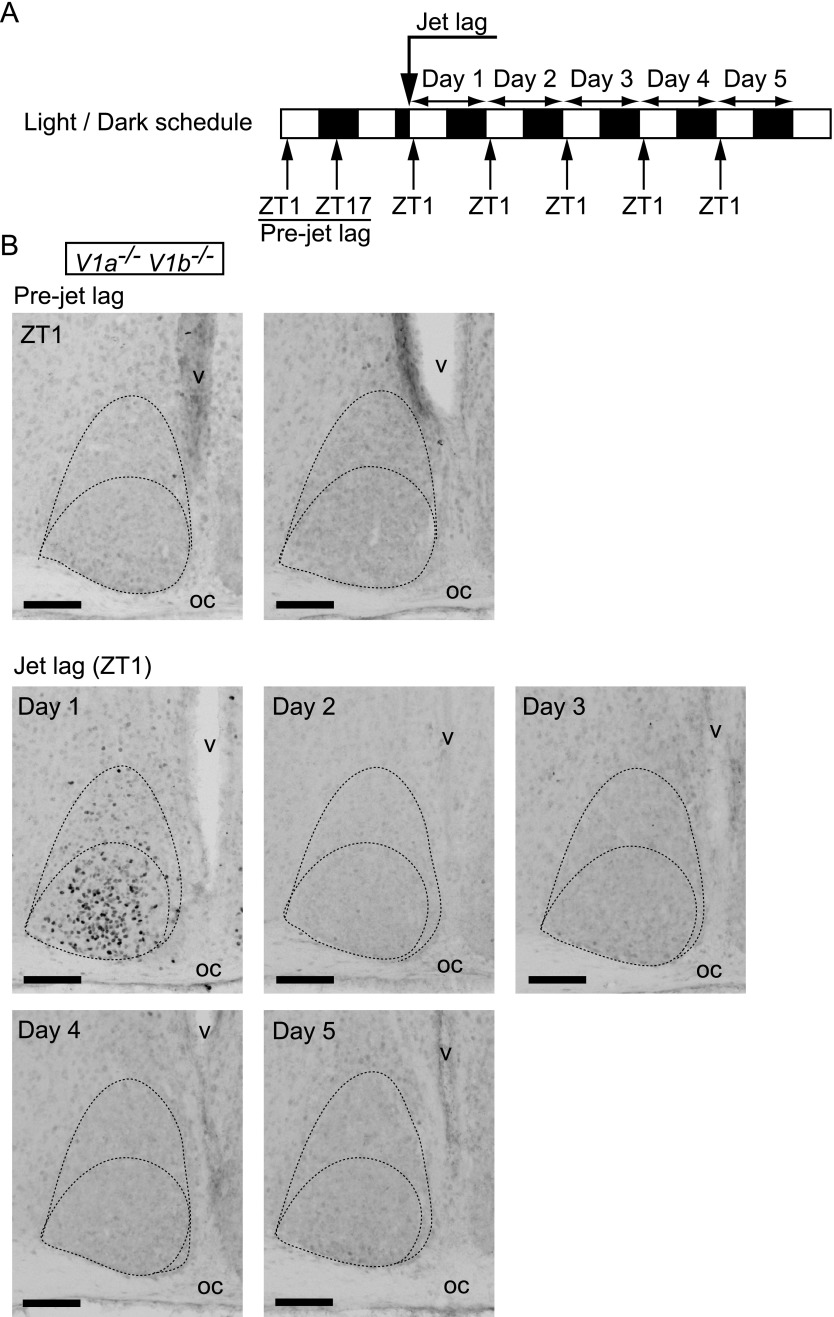
Fig. 3.
c-Fos expression in V1a–/–V1b–/– SCN before or after jet lag. (A) Sampling time course. White and black bars indicate light and dark phases, respectively. (B) Representative images of immunoreactivity to c-Fos in the SCN of V1a–/–V1b–/– mice before or after jet lag. Boundaries of the SCN and the ventrolateral and the central parts are shown in the dotted lines. oc, optic chiasma; v, third ventricle. Bar = 100 μm.

