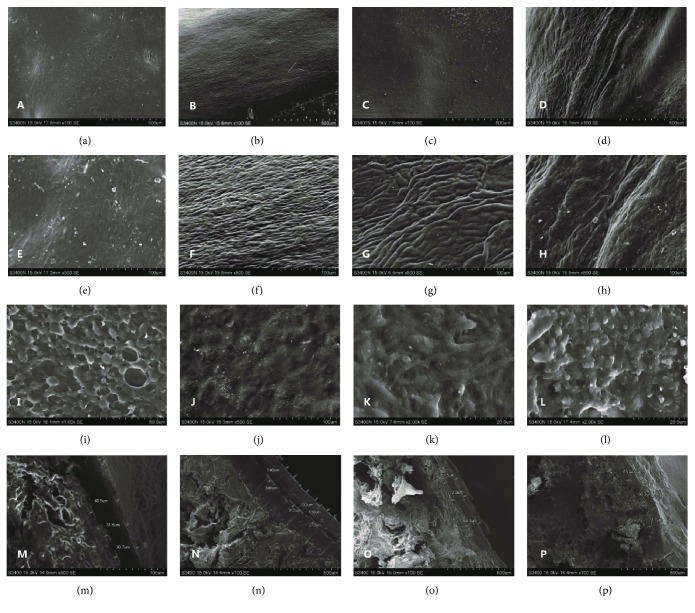
Figure 7.
The canine knee cartilage images by SEM: (a) cross section of the untreated control group (×100 SE), (b) cross section of the normal control group (×100 SE), (c) cross section of the central neogenetic cartilage in the treated group (×100 SE), (d) cross section of the surrounding neogenetic cartilage in the treated group (×100 SE), (e) cross section of the untreated control group (×500 SE), (f) cross section of the normal control group (×500 SE), (g) cross section of the central neogenetic cartilage in the treated group (×500 SE), (h) cross section of the surrounding neogenetic cartilage in the treated group (×500 SE), (i) cross section of the untreated control group (×1000 SE), (j) cross section of the normal control group (×500 SE), (k) cross section of the central neogenetic cartilage in the treated group (×2000 SE), (l) cross section of the surrounding neogenetic cartilage in the treated group (×2000 SE), (m) vertical section of the untreated control group (×100 SE), (n) vertical section of the normal control group (×100 SE), (o) vertical section of the treated group a (×100 SE), and (p) vertical section of the treated group b (×100 SE).

