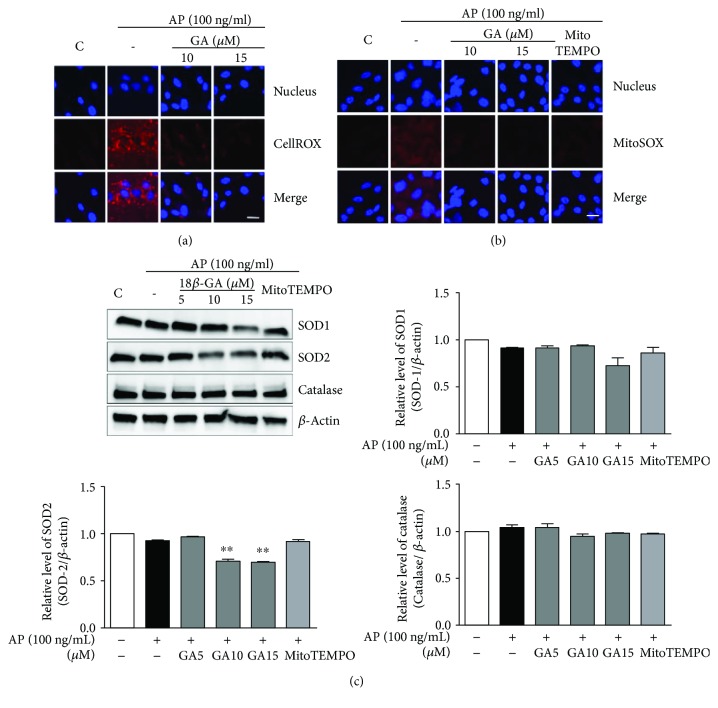
Figure 4.
Inhibitory effects of GA on the production of intracellular and mitochondrial ROS. (a) The level of intracellular ROS following GA treatment and Aspergillus protease stimulation was evaluated using CellROX. (b) Mitochondrial ROS were evaluated using MitoSOX and analyzed with confocal microscopy after stimulation with Aspergillus protease (magnification 130x, scale bar = 20 μm). (c) SOD-1, SOD-2, and catalase levels were determined in BEAS2B cells after GA treatment following Aspergillus protease stimulation by Western blot analysis. β-Actin was used as an internal control. Images were quantified using ImageJ. ∗∗P < 0.01 compared with the Aspergillus protease stimulation-only group.

