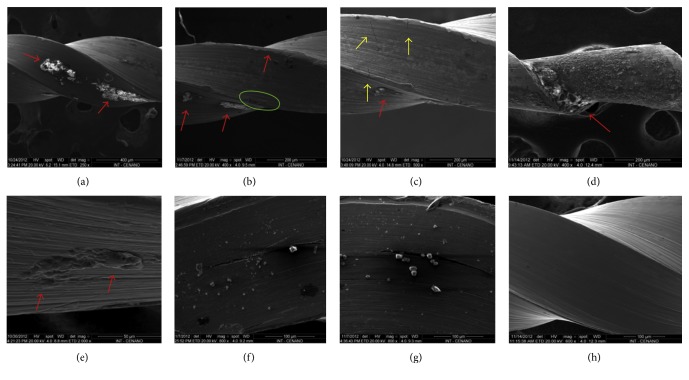
Figure 2.
SEM analysis photomicrographs: UEF-3 sample (a, b, c) with areas suggestive of biofilm formation (red arrows), machining grooves in the metal structure (green marking (b)) and areas with cracks (yellow arrows (c)); UEF-4 sample with image suggestive of biofilm formation along the entire metal surface (d), with the highest density of the supposed biofilm indicated by the red arrow; sample UEF-5 (e), area of biofilm formation (red arrow); UEF-1 sample showing deposition of amorphous structures on the metal surface (f, g) and control sample (h).

