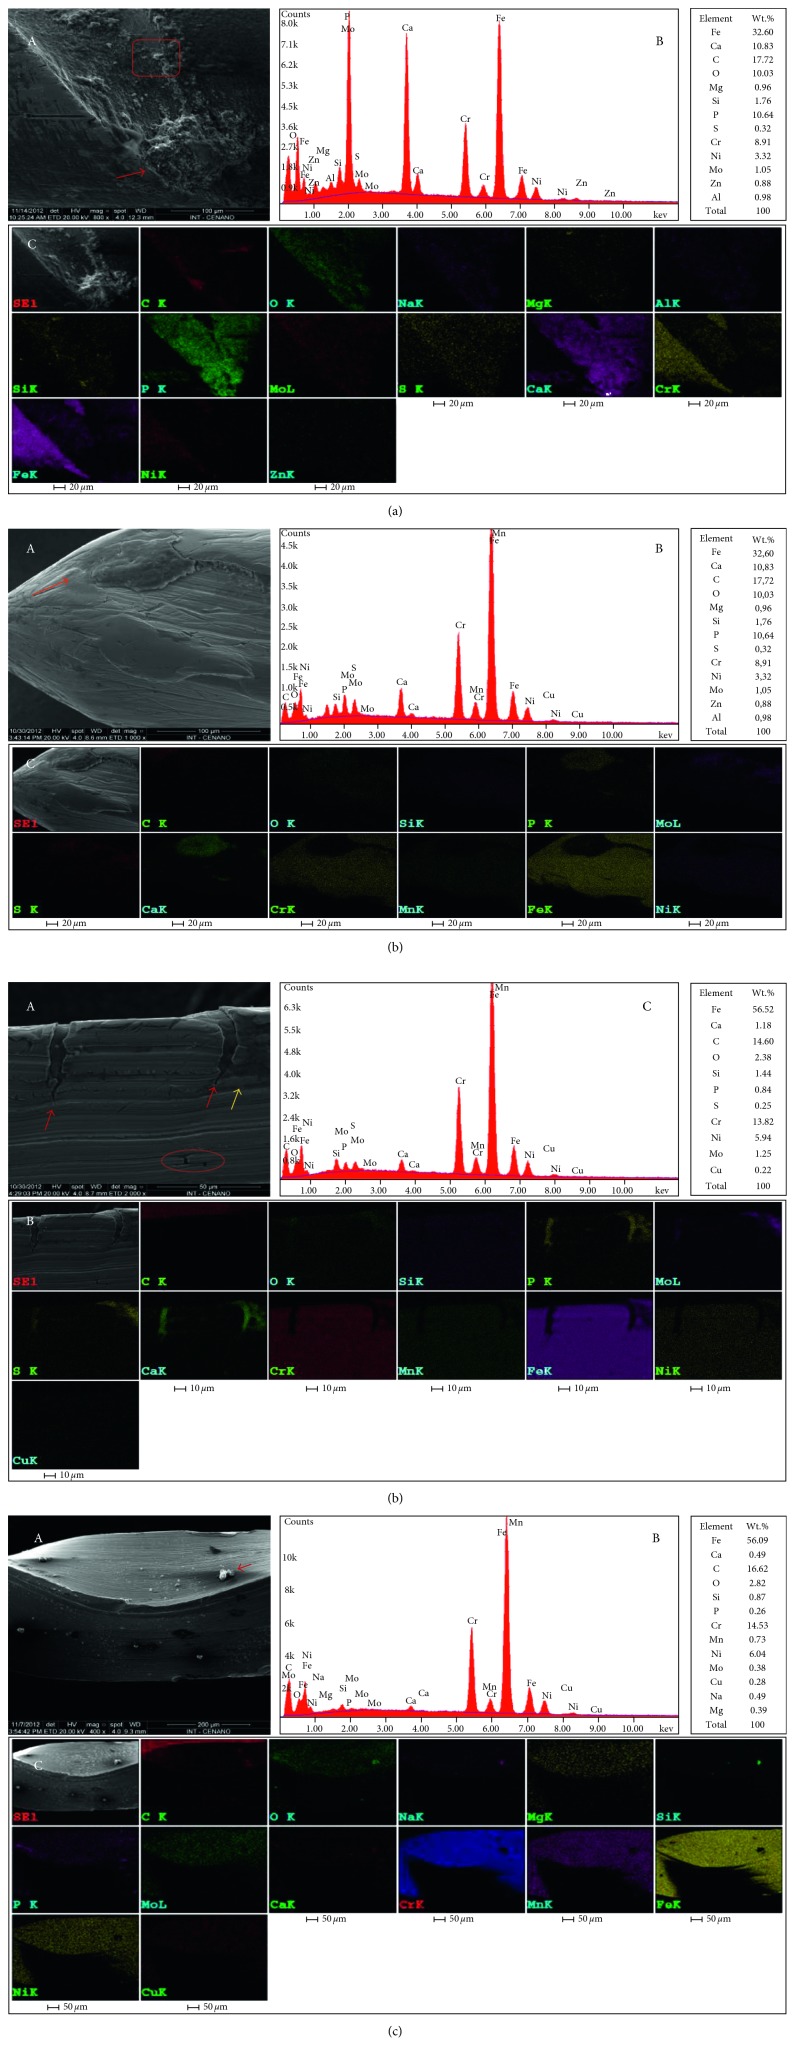
Figure 4.
Composition of the spectra of UEF-4 (a), UEF-2 (b and c), and UEF-1 (d). Correlation of images obtained in the SEM-EDS mode (a-A and d-A) and SEM-EDS (b-A and c-A) with the chemical spectrum obtained in the SEM-EDS mode (B) X-ray mapping (C) demonstrating the spatial distribution of the chemical elements. The images reveal the largest areas of mature biofilm formation (red arrows), the area marked by red square indicates the biofilm interface and metallic surface (a-A), area suggestive of corrosion (yellow arrow) (c-A), and area suggestive of pits (marked by the red circle) (c-A). However, the composition of (d) show a point with high concentration of (C) O, Na, and Si.

