Figure 1.
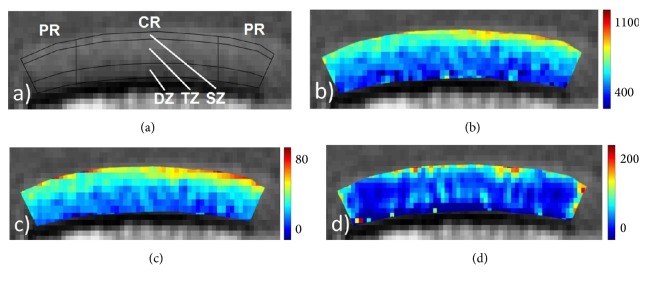
(a) T2-weighted morphological mid-sagittal image with a definition of the segmentation routine and the regions-of-interest: central region (CR, width of 6 mm); peripheral region (PR, adjacent to CR on both sample sides); superficial zone (SZ, 0–15% of sample depth); transitional zone (TZ, 15–65%); deep zone (DZ, 65–100%). (b–d) Corresponding T1 (b), T2∗ (c), and T1ρ (c) maps. Scales extend from 400 to 1100 ms (b), 0 to 80 ms (c), and 0 to 200 ms (d).

